
Fig 2. Disease Heatmap Based on Gene Expression Variation Profiles.
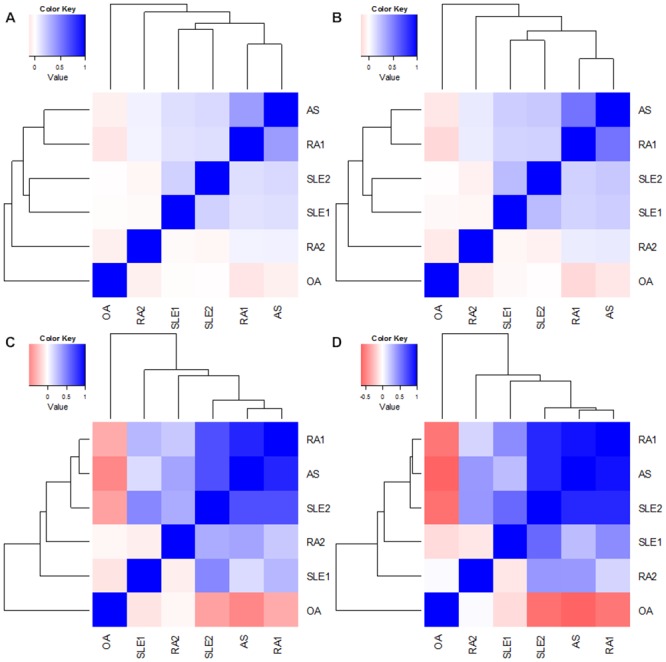
This diagram shows correlations between gene expression variation profiles of various rheumatic diseases. (A) Hierarchical cluster with Kendall correlation based on the whole gene expression variation profile; (B) Hierarchical cluster with Spearman correlation based on the whole gene expression variation profile; (C) Hierarchical cluster with Kendall correlation based on the eight common genes; (D) Hierarchical cluster with Spearman correlation based on the eight common genes. Positive and negative correlations between pairs of diseases are shown in blue and pink, respectively.