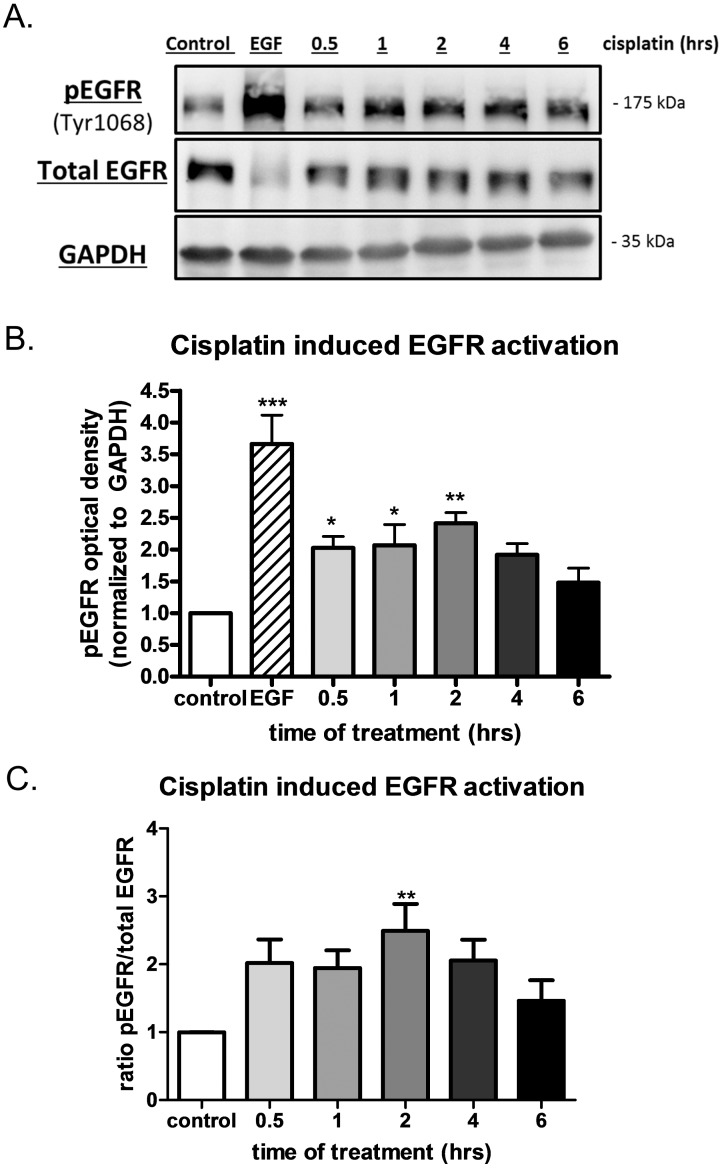
Fig 1. Acute cisplatin activates the Epidermal Growth Factor Receptor (EGFR).
A) Representative western blots of activated or phosphorylated EGFR (pEGFR, tyr1068) in OVCA 433 cells given 10 μM cisplatin for 0.5, 1, 2, 4 and 6 hours compared to untreated control cells. 10 nM EGF given to cells for 15 minutes as a positive control showing activation of the receptor. Total EGFR blot and GAPDH representative blots also shown. B) Graph of EGFR activation following 10 μM cisplatin treatment for 0.5, 1, 2, 4 and 6 hours, n = 6. EGF data shown as a positive control. C) Graph showing ratio of pEGFR to total EGFR (pEGFR/total EGFR ratio) following 10 μM cisplatin treatment for 0.5, 1, 2, 4 and 6 hours, n = 6. One-way ANOVA of data revealed a significant effect of cisplatin treatment and significant differences from control as determined by Dunnet’s post hoc analysis indicated by *p<0.05, **p<0.01, ***p<0.001.

