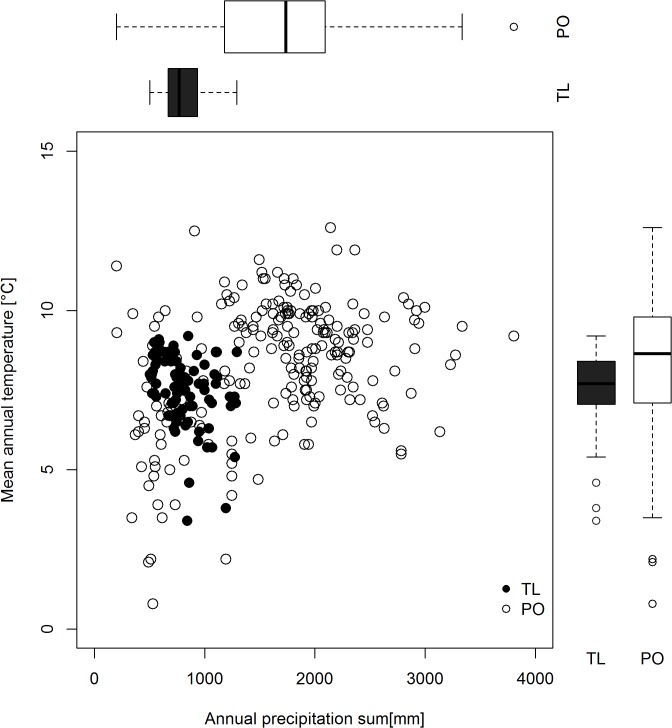
Fig 3. Climatic location of trials and the provenance origin.
Distribution of trial locations (TL = black dots and boxplots) and population’s origin (PO = white circles and boxplots) in a bioclimatic parameter space represented by mean annual temperature [°C] and annual precipitation sum [mm]. Although the trial locations fit well into the parameter space of the population origin for these two climate parameters, they show significant variation for other, more seasonal climate parameters, as shown by S1 Fig; indicating non analogy between climate of trial locations and population origin.

