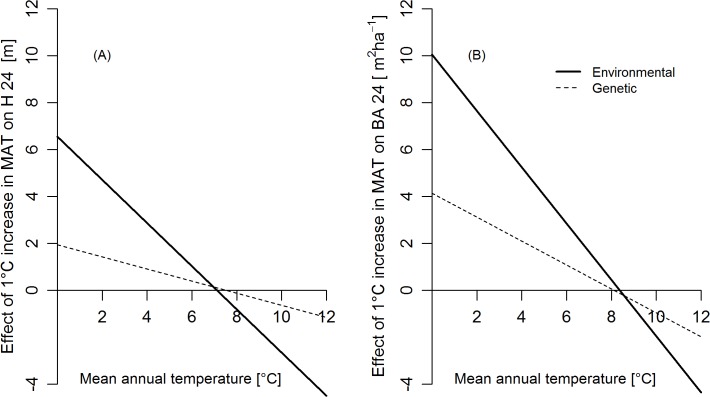
Fig 4. Environmental vs genetic effect.
Change in A) H24 and B) BA24 associated with a 1°C change in MAT of trial sites (environmental effect) and at population origin (genetic effect). For example: in a trial site with (MAT = 0°C), an increase of 1°C in MAT will result in 6.5 m increase in H24 and a population originating from 1°C MAT will be 2m taller than a population originating from 0°C MAT.

