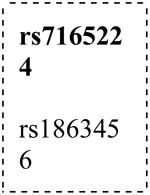
Table 3. Association results (P < 0.01).
| Gene | SNP | Chr | Position | Location | Alleles | MAF | P | Model | OR (95 % CI) | ||||
|---|---|---|---|---|---|---|---|---|---|---|---|---|---|
|
|
|||||||||||||
| EA | AA | EA | AA | ||||||||||
|
|
|
||||||||||||
| OD±CD | OD±CD | CD | OD±CD+CD | ||||||||||
| DBI | rs12613135 | 2 | 119364764 | Upstreamb | C/T | 0.27 | 0.30 | 0.006 | (0.02) | R | 2.48 (1.3-4.7) | ||
| GABRB2 | rs3816596 | 5 | 161548326 | Upstream | C/T | 0.34 | 0.50 | 0.009 | (0.02) | R | 0.56 (0.4-0.9) | ||
| rs6882041 | 5 | 161515394 | Intron | C/T | 0.27 | 0.31 | (0.01) | 0.008 | R | 0.47 (0.3-0.8) | |||
| GABRB3 |

|
15 | 26779189 | Upstream | C/T | 0.07 | 0.21 | (0.04) | 0.003 | (0.04) | 0.005 | D | 1.71 (1.2-2.5) |
| 15 | 26728885 | Intron | A/G | 0.48 | 0.15 | 0.008 | (0.02) | D | 0.56 (0.4-0.9) | ||||
| GAD1 | rs1978340c | 2 | 170813611 | Upstream | C/T | 0.27 | 0.09 | 0.006 | (0.01) | D | 1.85 (1.2-2.9) | ||
| rs2058725 | 2 | 170833611 | Intron | A/G | 0.27 | 0.37 | 0.004 | (0.01) | 0.001 | R | 0.47 (0.3-0.7) | ||
| GRIN2A | rs1833161 | 16 | 9791170 | Intron | T/Ca | 0.32 | 0.42 | (0.04) | 0.009 | R | 1.77 (1.2-2.7) | ||
| GRIN2B | rs2284416 | 12 | 1376628 0 | Intron | T/G | 0.49 | 0.44 | (0.01) | (0.04) | 0.006 | R | 0.57 (0.4-0.9) | |
| GRIN2C | rs689730 | 17 | 74854994 | Ala33= | C/T | 0.09 | 0.21 | 0.004 | (0.03)d | D | 1.76 (1.2-2.6) | ||
| GRM1 | rs1997766 | 6 | 146180786 | Intron | T/C | 0.006 | 0.18 | 0.008 | (0.03) | 0.006 | D | 0.62 (0.4-0.9) | |
SNPs with P values < 0.01 in at least one analysis are listed. For these SNPs, P values < 0.05 in the other analyses are also listed.
Blank cells represent P > 0.05.
The complete results (P < 0.05) are listed in Supplement Table 2
Alleles are listed with the major allele (in EA) first.
The model and OR refers to the minor allele. OR is listed for the lowest P value (in bold) but the other analyses for the same SNP showed the same direction, model and similar OR range unless indicated. OR > 1 represent risk effect of the minor allele (in bold), OR < 1 represent protective effect of the minor allele.
The bolded SNP was previously associated with OD in AA (Levran et al. 2009) and in Han Chinese (Zhao et al. 2013, Zhong et al. 2014)
Box represnet LD (D′ = 1, r2 < 0.1 in EA and AA)
the minor allele in AA is the major allele in EA
This SNP is also located at an intron of C2orf76 (chromosome 2 open reading frame 76).
This SNP showed an effect on GABA levels in prefrontal cortex
The association of OD±CD in AA was in the opposite direction comapre to the OD±CD in EA (OR (95% CI) 0.66 (0.45-0.96)). Chr, Chromosome; MAF, minor allele frequency; EA, European/Middle Eastern ancestry; AA, African Americans; OD, opioid dependence; CD Cocaine dependence; OR, Odds ratio; CI, confidence interval; D, dominant; R, recessive
