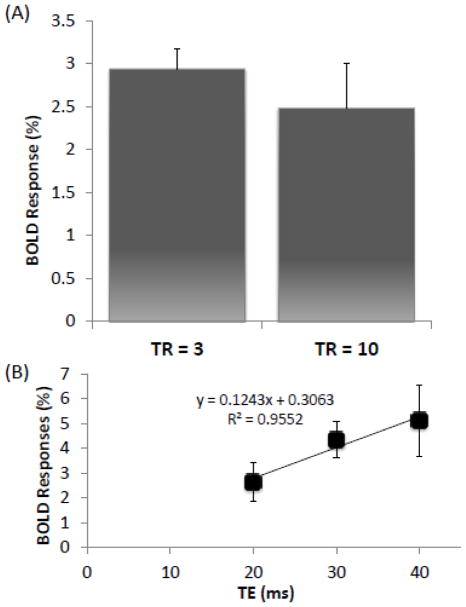
Figure 3.
(A) Evoked BOLD response during HBO in the somatosensory cortices using different repetition times (TR). (B) Evoked BOLD response during HBO in the somatosensory cortices using different echo times. The solid line is calculated trend-line for evoked BOLD response to different echo times. ROI’s are located on the S1 region. Mean ± SEM for N = 3. There were no statistically significant differences between the two TRs. The percent change, extrapolated to echo time = 0 ms, was not significantly different from baseline (0 percent change).

