
Figure A.6.
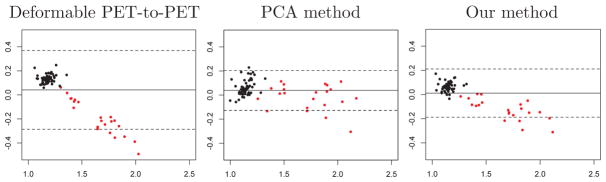
Bland-Altman plots for mean cortical SUVR calculated using 50–70 minute time frames registered based on 50–70 minute PiB-PET. The horizontal axis shows the mean of the measured mean cortical SUVR and the ground truth, and the vertical axis shows the difference between the two. The solid horizontal line corresponds to the mean difference, and the dashed lines indicate its 95% confidence interval. Black and red data points correspond to PiB− and PiB+ individuals, respectively.