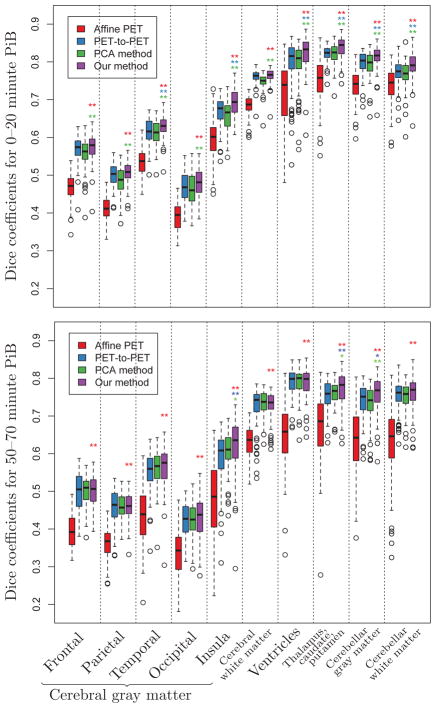
Figure 7.
Box plots of Dice coefficients for cortical labels across 79 subjects calculated using the deformations obtained from affine PET-to-PET registration (red), deformable PET-to-PET registration (blue), the PCA method (green), and our method (purple). Statistically significant differences between our method and affine PET-to-PET registration, deformable PET-to-PET registration, and the PCA method are indicated with red, blue, and green asterisks, respectively (* : p < 0.05, ** : p < 0.01). For references to color, the reader is referred to the web version of this article.

