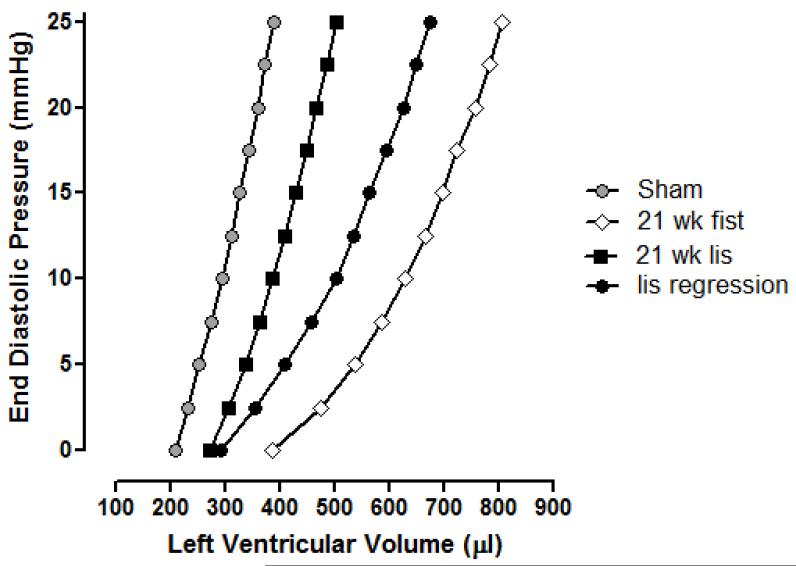
Figure 1.
Effect of lisinopril treatment on left ventricular end diastolic pressure and left ventricular end diastolic volume relationships in the rat AV fistula model of heart failure. Each curve represents the average values for that group. Sham group (n=10) P-V relationship is significantly different from the 21wk AV fistula group (n=14; p<0.05). P-V relationship for the 21wk lisinopril group (n=9) was not significantly different from shams, but was significantly different to the 21wk AV fistula group (P<0.05). P-V relationship for the lisinopril regression group (n=12) was significantly different from the sham group (P<0.05), but was not different from the 21wk AV fistula group.

