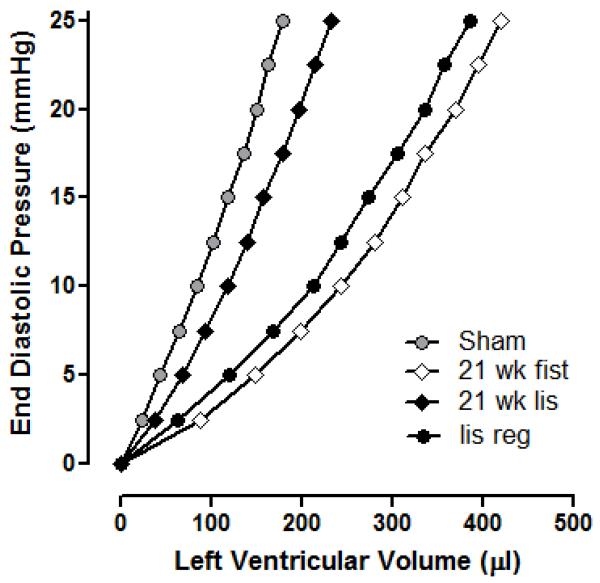
Figure 2.
The P-V relationship normalised for LV volume that produced an EDP of 0 mmHg to illustrate the effect of lisinopril on changes in ventricular compliance. Each curve represents the average values for that group. Sham group (n=10) P-V relationship is significantly different from the 21wk AV fistula group (n=14; p<0.05). P-V relationship for the 21wk lisinopril group (n=9) was not significantly different from shams, but was significantly different to the 21wk AV fistula group (P<0.05). P-V relationship for the lisinopril regression group (n=12) was significantly different from the sham group (P<0.05), but was not different from the 21wk AV fistula group.

