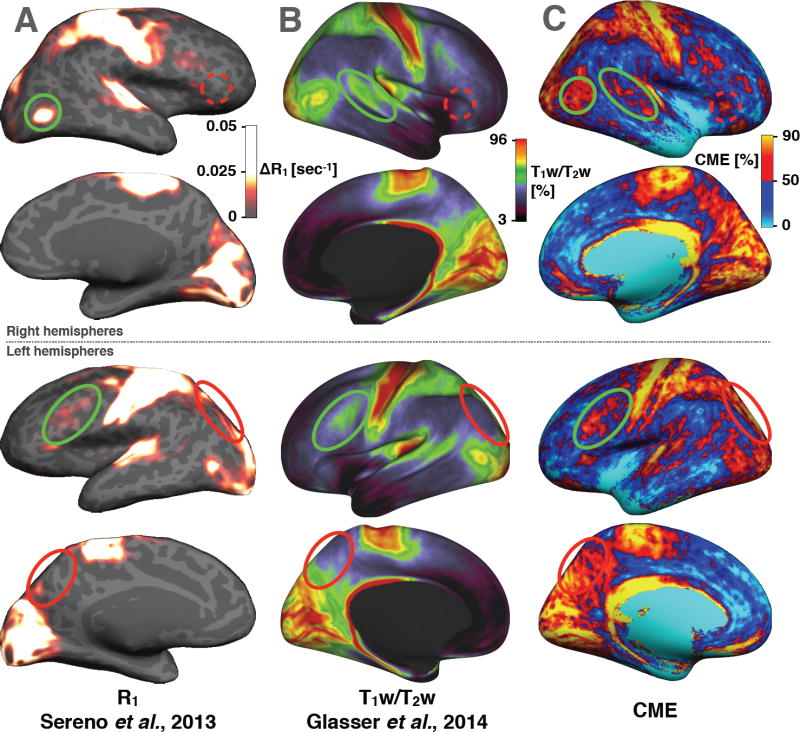
Figure 11.
Comparison with recent in vivo studies showing different contrasts sensitive to cortical myelin content in healthy adults. (A) quantitative R1 maps averaged across 6 control subjects (Sereno et al., 2013). ΔR1 is the difference between the mean R1 (across the cortex) and the R1 in a specific vertex. (B) T1w/T2w maps averaged across 69 subjects (Glasser and Van Essen, 2011). (C) CME maps averaged across 6 subjects, unsmoothed. Green circles show similarities between CME maps and R1 or T1w/T2w. Red circles show differences.

