
Figure 2.
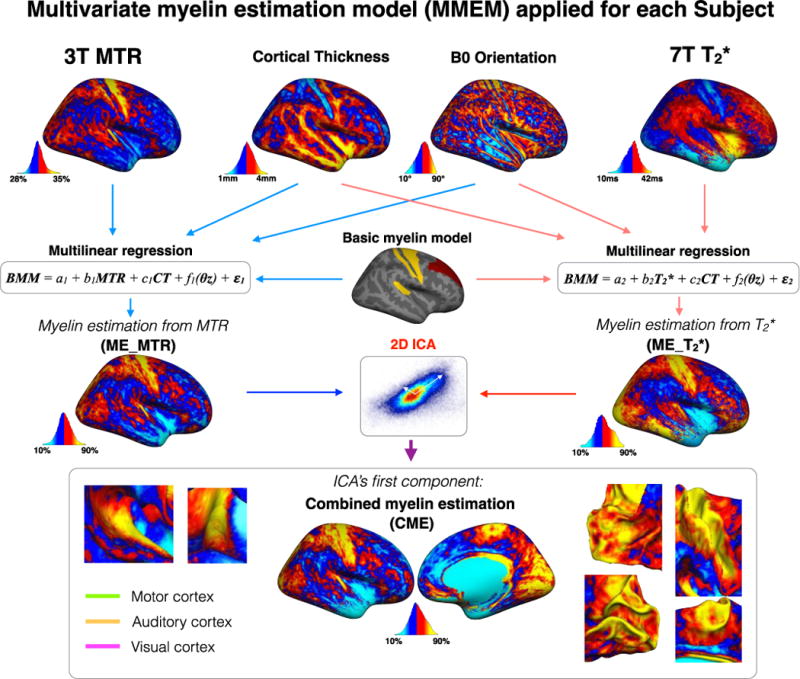
Multivariate myelin estimation model (MMEM). MMEM aimed to estimate a cortical myelin map using MTR, T2*, cortical thickness (CT) and B0 orientation maps. The MMEM was divided into two steps. Firstly, two maps were estimated using multi-linear regressions: one using MTR, CT and B0 orientation (ME_MTR) and one using T2*, CT and B0 orientation (ME_T2*). ME_MTR and ME_T2* maps represent myelin-correlated values corrected for partial volume effect and fibers orientation. In order to merge MTR and T2* within the same framework, both linear regressions were performed with a common dependent variable (BMM). Secondly, the shared information between ME_MTR and ME_T2* was extracted using ICA decomposition, for each subject. The ICA decomposed the signal into two component that are mathematically independent. The ‘so-called’ first component of the ICA was the source that share the highest variance between ME_MTR and ME_T2*. The hypothesis being that the first component of the ICA was an indicator for myelin content.