
Figure 5.
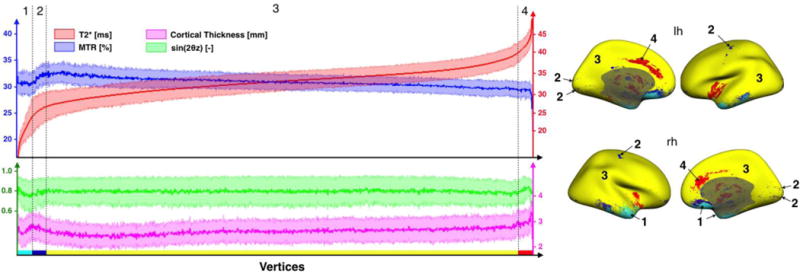
The graph on the left panel shows the distribution of the four signals used in the MMEM: MTR (blue), T2* (red), CT (magenta) and B0 orientation (green). The abscissa represents vertices defining the cortical surface (total number of vertices = 163,842). For clarity, the vertices order was chosen to make T2* increasing and values were smoothed along the abscissa (100-point window). Error strips represent the inter-subjects SD. Similar trends are observed between the left and the right hemispheres, therefore only the signal of the right hemisphere was plotted. The distribution graph was divided into four ensembles of vertices (1, 2, 3 & 4) based on their signal’s shapes. Vertices corresponding to these regions are plotted on the right panel with the respective colors: light blue, dark blue, yellow & red.