
Figure 7.
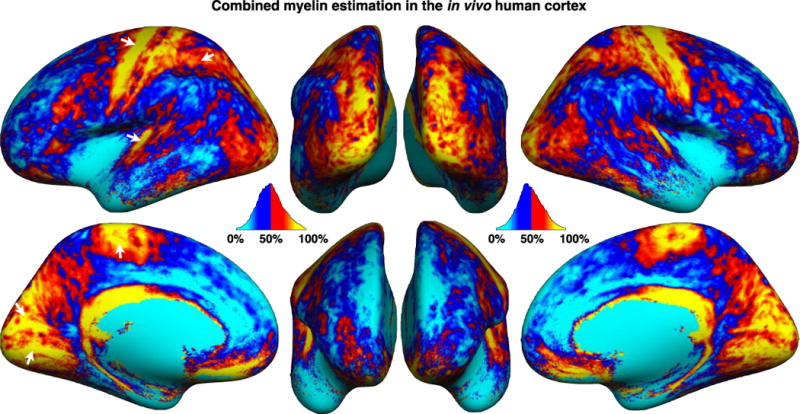
Average map of the Combined Myelin Estimation (CME). The mean and SD of CME across the cortex was 50.3±0.7. Overall, we notice a high myelin estimation (yellow/red) in the primary motor cortex BA4=74±3% (here, % refers to the CME metric, and ±3% refers to the SD across subjects) and in the primary somatosensory cortex (BA1=67±7%, BA2=59±4% and BA3=63±13%). Moreover, a high myelin estimation is also observed in the visual cortex (BA17=67±5% & BA18=68±6%) and the auditory cortex (BA42=57±10%).