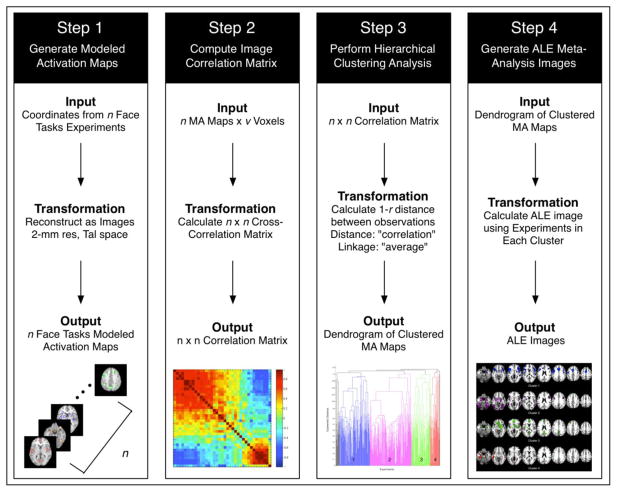
Figure 1. Data Analysis Pipeline.
Step 1: Per-experiment coordinate-based data were extracted from BrainMap and used to generate modeled activation (MA) maps. Step 2: A pairwise correlation analysis was performed in which correlation coefficients were calculated for each n experiment compared to every other n experiment. Step 3: Experiments were grouped into clusters using hierarchical clustering analysis. Step 4: Meta-analysis of the per-cluster set of experimental MA-maps was performed using the activation likelihood estimation (ALE) method.

