
Figure 2. Cluster Criteria.
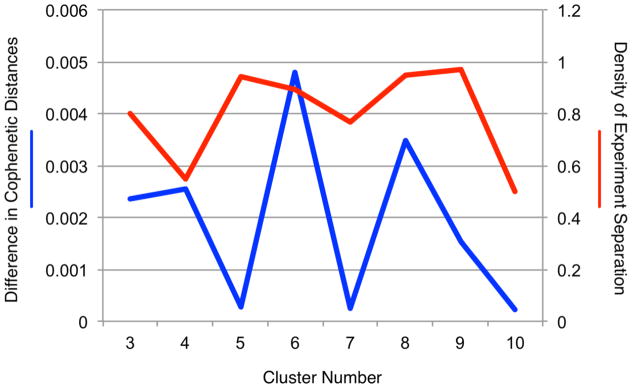
The difference in cophenetic distances (blue) and density of experiment separation (red) are plotted as a function of candidate model orders. Peaks in the difference in cophenetic distances indicate that the corresponding clustering solution results in clusters with substantially different activation patterns than the model order below it. Decreases in density of experiment separation indicate a given solution yields clusters of non-trivial size, providing robustly different activation patterns. Convergence across both metrics was observed for a solution of 6 clusters.