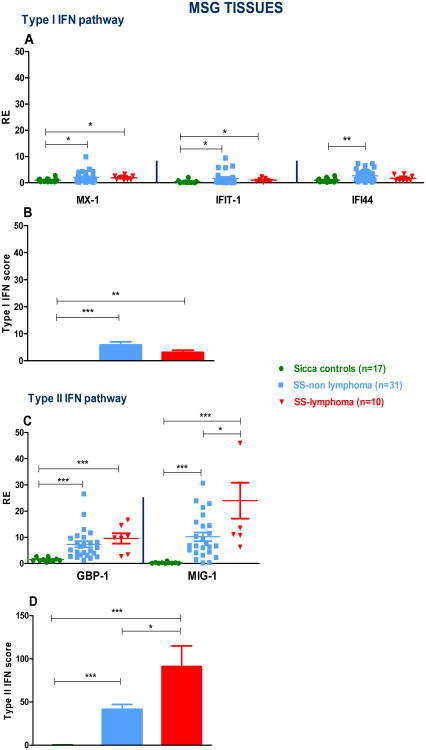
Fig. 2. Type I and II IFN inducible genes (IFIGs) as well as type I and II interferon (IFN) scores in minor salivary glands (MSG) from Sjogren's patients (SS) and sicca controls (SC).
A. Normalized relative mRNA expression of the preferentially type I IFIGs MX-1, IFIT-1 and IFI44 in MSG tissues from 17 SC, 31 SS-non lymphoma and 10 SS-lymphoma patients. Transcript levels of the MX-1, IFIT-1 and IFI44 genes were lower in SC compared to both SS non-lymphoma (p-value: 0.02, 0.02 and 0.005, respectively) and SS-lymphoma groups (p- values: 0.01, 0.04 and 0.07, respectively), while no statistically significant differences were observed between SS subgroups. B. Type I IFN score was significantly increased in both SS subgroups complicated or not by lymphoma compared to SC (p-values: 0.004 and 0.0003, respectively), with no significantly detectable differences between SS subgroups. C. Normalized relative mRNA expression of the preferentially type II IFIGs GBP-1 and MIG-1 in MSGs from 17 SC, 31 SS-non lymphoma and 10 SS-lymphoma patients. Transcript levels of the GBP-1 and MIG-1 genes were significantly decreased in SC vs. both SS non-lymphoma (p-values: <0.0001 for both genes) and SS-lymphoma (p-values: 0.0002 and 0.0001, respectively); of note, significantly increased MIG-1 transcript levels were observed in SS-lymphoma compared to SS-non lymphoma group (p-value: <0.05). D. Type II IFN score was found to be significantly increased in both SS subgroups complicated or not by lymphoma compared to SC (p-values: 0.0001 and <0.0001, respectively), as well as in SS-lymphoma patients compared to the SS-non lymphoma group, p-value: 0.045. (*p<0.05, **p<0.01, ***p<0.001). RE: Relative expression.

