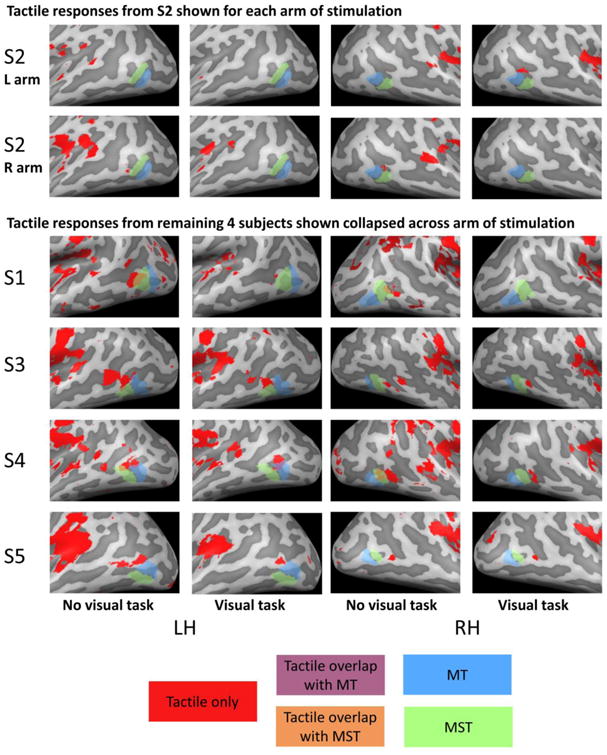
Figure 2.

Cortical surface maps for tactile responses for the no visual task and visual task conditions. Upper panels show responses from a single subject for left and right arm separately. Lower panels show responses in the remaining 4 subjects, with responses collapsed across left and right arms such that voxels were considered responsive to tactile stimulation if they responded to tactile stimulation of either the left or the right arm. Significant responses to tactile stimulation of either the left or right arm vs. rest (q(FDR) < 0.05) is shown in red, MT is shown in blue, MST is shown in green. Overlap between tactile responses and MT and MST are shown in purple and orange respectively.
