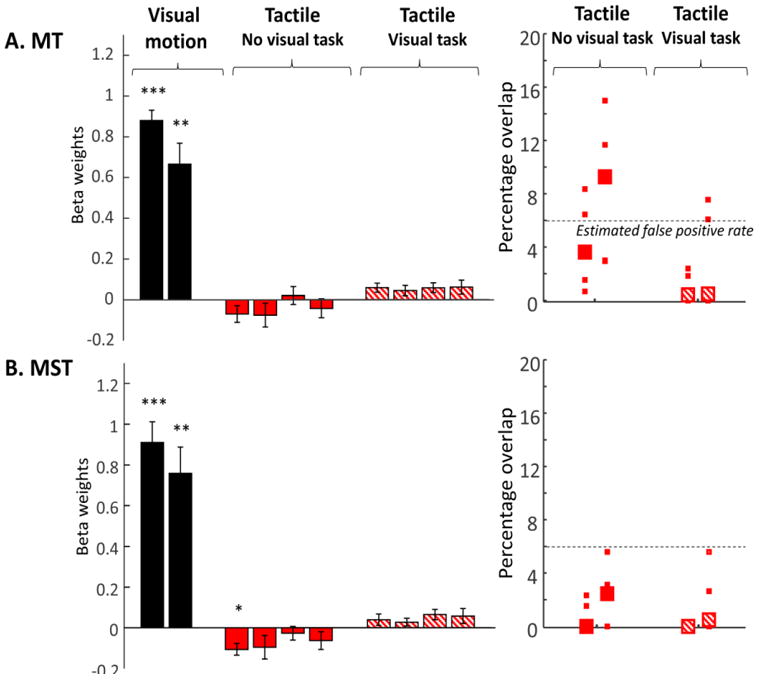
Figure 3.

Leftward panels show Beta weights for tactile responses within MT and MST. For comparison, responses to the contralateral visual motion stimulus are shown for each ROI (black bars). Responses in the absence of a distractor visual task are shown in red, and responses in the presence of a distractor visual task are shown with red hatched bars. Data are shown separately for left and right hemispheres, and left and right arms of stimulation. Each bar represents data averaged across subjects and single standard error bars are shown. Asterisks represent whether responses were significantly different from zero. * p<0.05, * p<0.01, * p<0.001. Rightward panels show the percentage of voxels within MT and MST that responded to tactile motion with and without a visual task. Again, voxels were considered to respond to tactile motion if they showed significant responses to tactile stimulation of either the left or the right arm vs. rest. The dotted line represents the number of voxels that might be expected to respond to tactile stimulation simply as a consequence of false positives.
