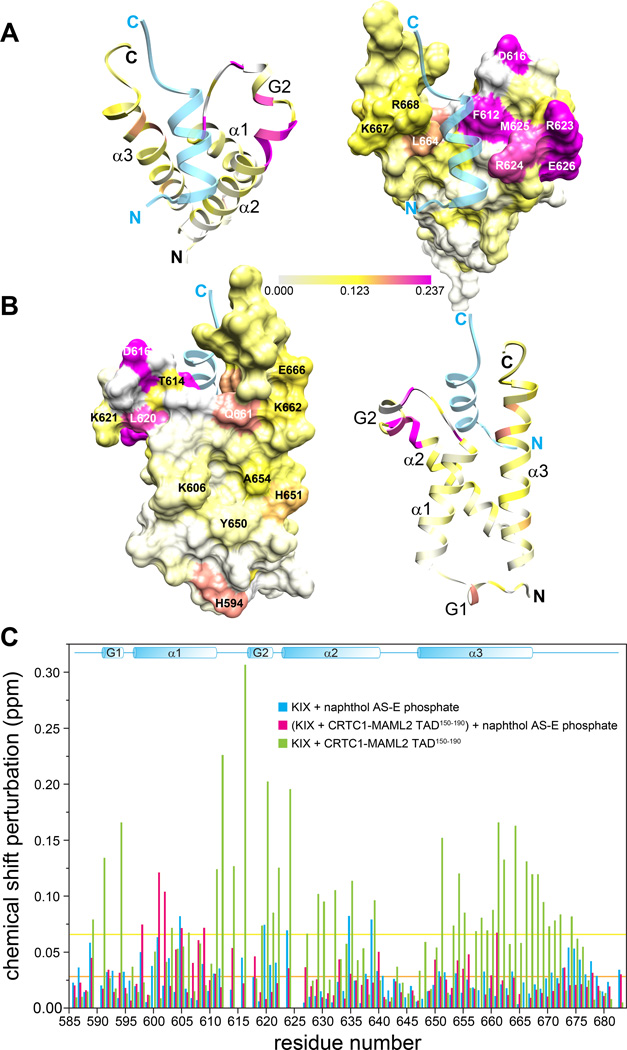
Figure 4. The CRTC1-MAML2 TAD1 binds to the MLL1-binding surface of KIX.
(A) Backbone amide CSPs induced by CRTC1-MAML2 TAD150–190 presented in Figure 1B mapped on to the backbone and molecular surface of KIX (PDB ID: 2AGH).(25) The coloring scheme follows the legend shown at the bottom of the panel. Note that KIX residues that show extreme line broadening are rendered with the same color as the maximally perturbed residue. The segment of MLL1 corresponding to residues 844–860 that shows similarity to CRTC1-MAML2 TAD150–190 (Figure 2C) is rendered as a semi-transparent ribbon. (B) Views of the principal CREB pKID-binding surface of KIX showing the same data as in panel A. (C) CSPs of KIX induced by naphthol AS-E phosphate in the absence (blue) and presence (red) of one equivalent of CRTC1-MAML2 TAD150–190; CSPs induced by CRTC1-MAML2 TAD150–190 are included for comparison (green). Protein concentrations as well as solution and experimental conditions were the same as those described in Figure 1A. The orange and yellow horizontal lines denote the average perturbations induced in KIX by naphthol AS-E phosphate (0.027 ppm for both KIX samples) and by CRTC1-MAML2 TAD150–190 (0.066 ppm).

