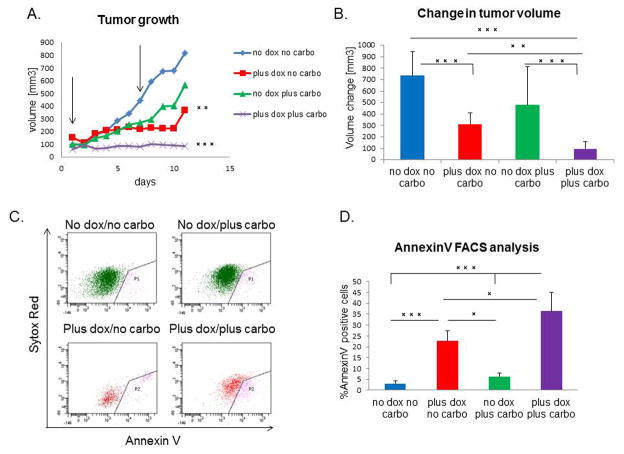
Figure 6. miR-200c sensitizes tumor cells to chemotherapy.
(A) DOX and carboplatin combination treatment caused tumor stasis, as seen by a significant difference in the growth rate of combination group, compared to all other treatment groups. Arrows point to the time of carboplatin injection. (B) There is a significant decrease in the average change in volume after treatment (n=20 for carboplatin+DOX group, n=15 for DOX only, n=8 for vehicle and carboplatin alone groups) (C–D) AnnexinV FACS analysis shows a significant increase in the number of cells undergoing early stages of apoptosis in the combination treatment group, as compared to all other groups. Sytox red staining represents dead cells, therefore cells positive only for AnnexinV were considered currently undergoing apoptosis. Analysis included only GFP+ or RFP+ cells, therefore AnnexinV positive cells are represented only through these gates, and quantified to the left.

