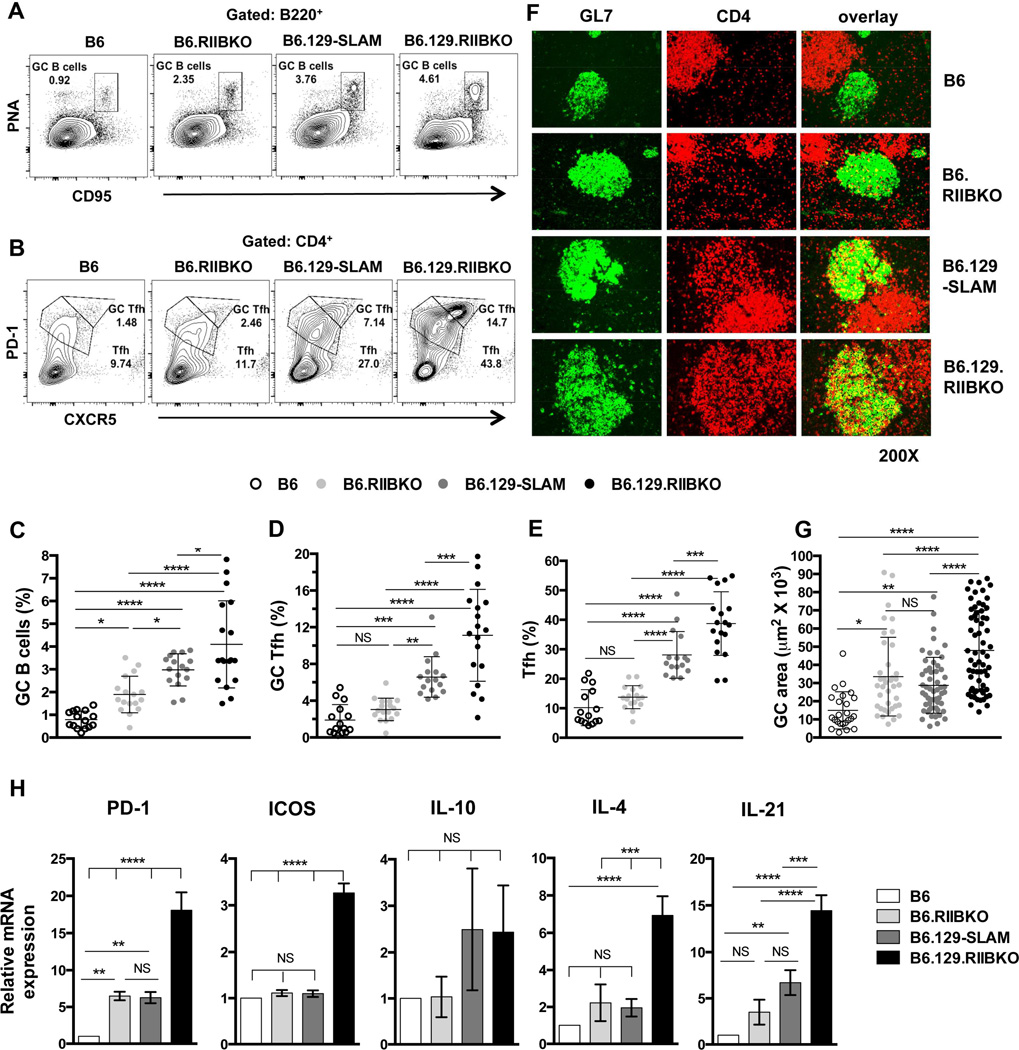
Figure 2. Analysis of GC B cells, Tfh and GC Tfh in B6, B6.RIIBKO, B6.129-SLAM and B6.129.RIIBKO mice.
(A) Representative contour plots show the gating strategy for B220+PNAhi CD95hi GC B cells (rectangular gate) in 6 mo old female mice of the indicated strains. (B) Similar analysis as in (A) showing the gating strategy for Tfh (CD4+CXCR5intPD-1int, lower polygonal gate) and GC Tfh (CD4+CXCR5hiPD-1hi, upper polygonal gate). Scatter plots show the percentage of GC B cells (C), GC Tfh (D) and Tfh (E) in total splenocytes from 6 mo old female mice of the indicated strains. Each symbol in C, D and E represents an individual mouse. (F) Representative images of spleen sections from 6 mo old mice, stained with fluorescently labeled Abs detecting GC B cells (GL7-green, left panels) and CD4+ T cells (red, middle panels). Right panels show the overlay of GL7 and CD4 staining. Immunofluorescence data are representative of at least 5–6 mouse spleens analyzed per genotype. (G) Stained sections in F were analyzed with the Leica LAS-AF software. The size (area in µm2) of 10–15 randomly selected germinal centers from each mouse of the indicated strain was measured. Spleen sections from 4–5 6 mo old mice were analyzed per group. Each symbol denotes one GC. (H) Quantitative RT-PCR analysis of mRNA transcripts of the indicated genes in sorted CD4+CXCR5hiPD-1hi GC Tfh cells from 6 mo old B6, B6.129-SLAM, B6.RIIBKO and B6.129.RIIBKO mice (n = 3–4 mice per genotype). Error bars show mean ± SD. NS= not significant, * p ≤ 0.05, ** p ≤ 0.01, ***p ≤ 0.001 and **** p ≤ 0.0001 (One-Way ANOVA).

