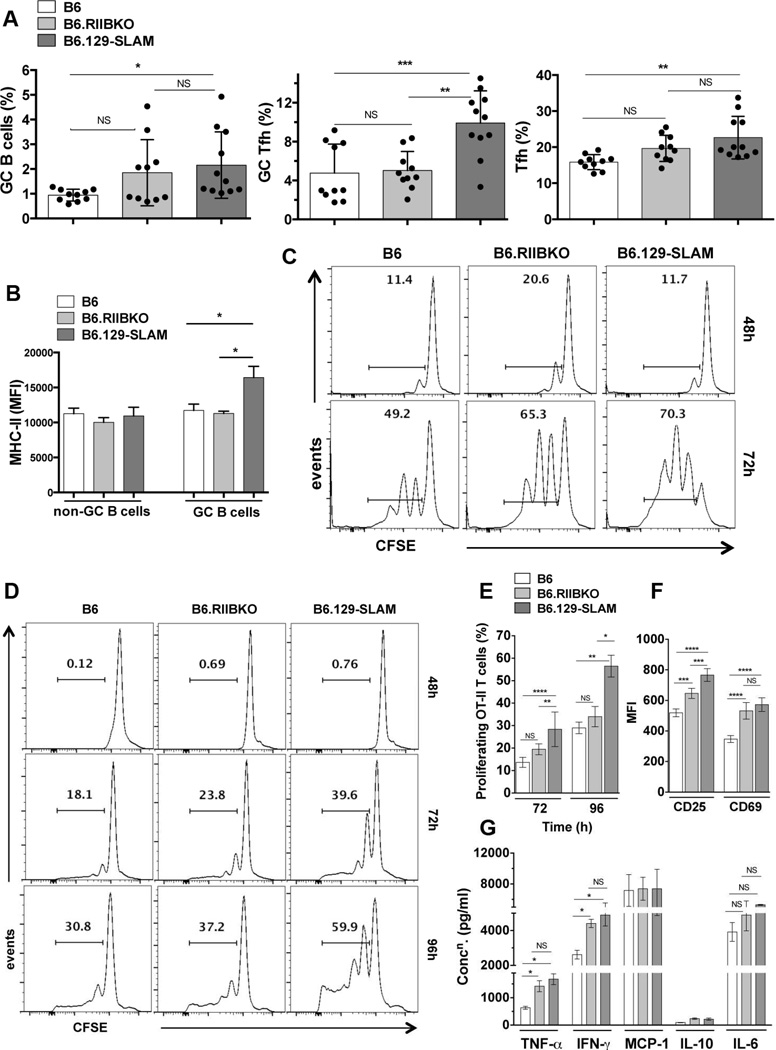
Figure 3. 129-SLAMs promote antigen presentation by B cells and DCs.
(A) Scatter plots with bars show the percentages of B220+PNAhi CD95hi GC B cells (left panel), CD4+CXCR5hiPD-1hi GC Tfh (middle panel) and CD4+CXCR5intPD-1int Tfh (right panel), in the indicated mouse strains, analyzed from total splenocytes 12 days after immunization with 200µg OVA/ mouse (i.p.). (B) Bar graphs show the mean fluorescence intensity of MHC-II expression on non-GC (B220+PNA−CD95−) and GC B cells (B220+PNAhi CD95hi), measured from mice described in A. These data represent two independent experiments (n = 10). (C) B cells from B6, B6.RIIBKO and B6.129-SLAM mice were differentiated into antigen presenting cells (B cell-APCs) as described in methodology. CFSE labeled purified naïve OT-II T cells were co-cultured with B cell-APCs. Representative histograms show OT-II T cell proliferation by CFSE dilution at 48h and 72h. (D) Representative histograms show OT-II T cell proliferation by CFSE dilution at 48h, 72h and 96h after co-culture with BM derived DCs (DC-APCs, described in methodology). (E) Percentage of proliferating OT-II T cells as described in D at 72h and 96h of co-culture. (F) Bar graphs show the mean fluorescence intensity of CD25 and CD69 surface expression on OT-II T cells co-cultured for 72h with DC-APCs from the indicated mouse strains. (G) Culture supernatants from DC-OT-II T cell co-cultures were collected at 72h and analyzed for the indicated cytokines using the flow cytometric cytokine bead array. Data in D-G are from three independent experiments, where DCs were differentiated from BM cells pooled from 3–4 mice per group for each experiment. NS= not significant, * p ≤ 0.05, ** p ≤ 0.01 and ***p ≤ 0.001 and **** p ≤ 0.0001 (Oneway ANOVA).

