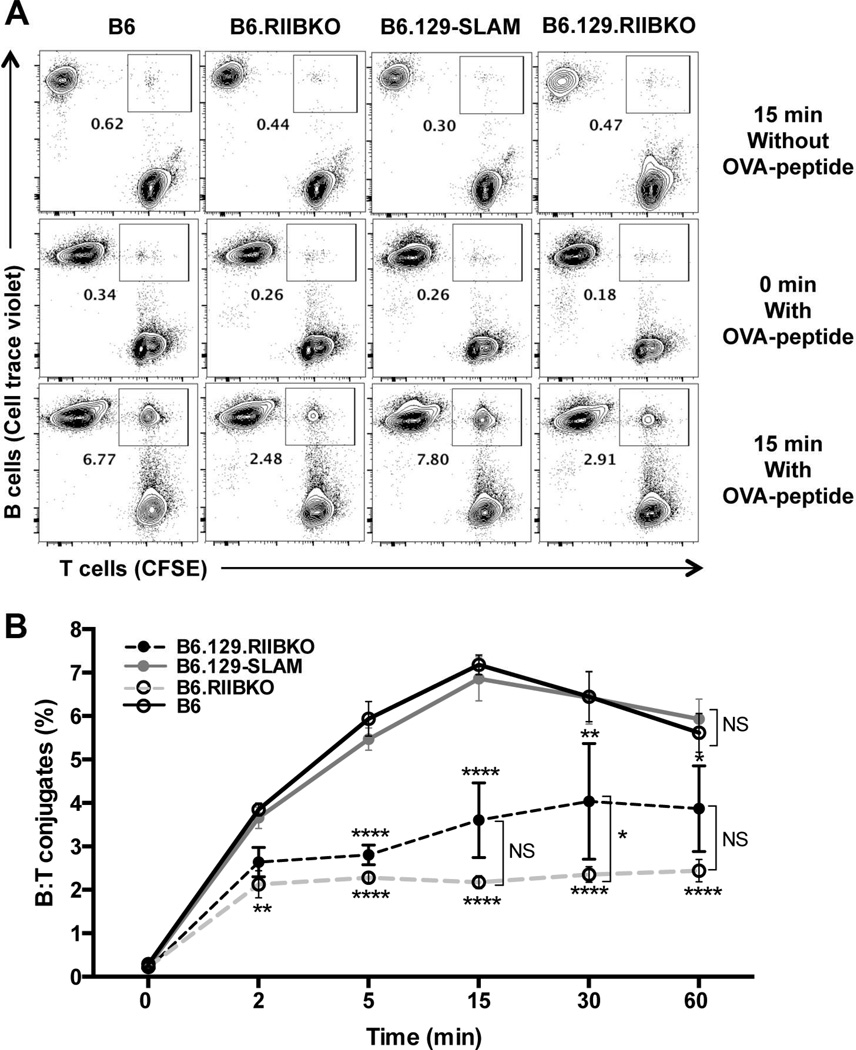
Figure 4. B6.RIIBKO B cells have a lower frequency of B: T interactions.
Activated B cells from the indicated mouse strains were intracellularly labeled with cell trace violet and incubated with activated CFSE labeled CD4+ B6.OT-II T cells as described in methodology. (A) Representative contour plots show the B: T cell conjugates within rectangular gates at 0 and 15 min time points (middle and lower panels respectively). Upper panels represent negative controls where B cells were not pulsed with OVA-peptide and incubated with OT-II T cells for 15 min. (B) Kinetics of the percentage of B: T conjugates formed over the course of 60 min. Data are compiled from 5 independent experiments, wherein B cells were pooled from 3–4 mice per group for each experiment. Error bars represent mean ± SD. NS= not significant, * p ≤ 0.05, ** p ≤ 0.01 and **** p ≤ 0.0001 (Two-way ANOVA).

