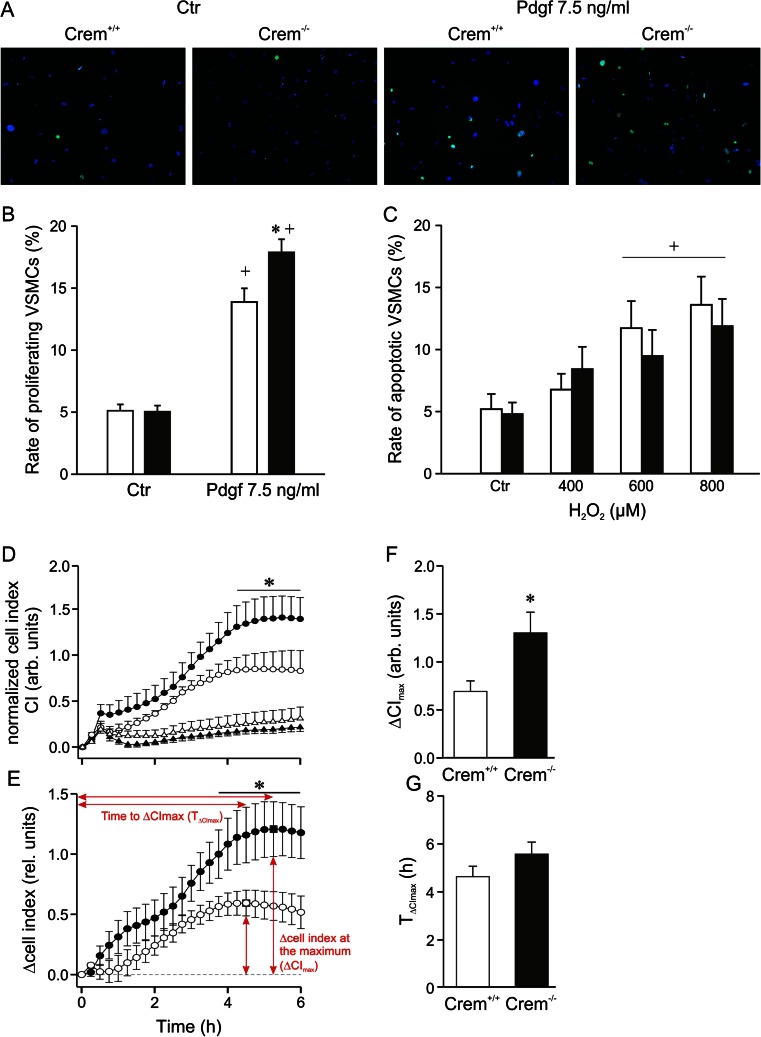
Fig. 5.
Detection of proliferating and apoptotic cells in primary isolated VSMCs from Crem+/+ (white bars) and Crem−/− (black bars) mice. a Immunofluorescence images of VSMCs stained with DAPI and a Ki-67 antibody to detect proliferating cells after stimulation with Pdgf (7.5 ng/ml, 24 h) compared to control conditions without stimulation (Ctr). b Quantitative analysis showed an increase in the percentage of proliferating VSMCs in Crem−/− vs. Crem+/+ VSMCs in the Pdgf-treated groups (n = 14/5). c Percentage frequency of apoptotic VSMCs was detected by TUNEL assay after 24-h stimulation with increasing concentrations of hydrogen peroxide. No differences between the genotypes were observed (n = 10/6). d Impedance-based real-time proliferation curves of vehicle-treated (triangle) and Pdgf (7.5 ng/ml)-treated VSMCs (circle) of Crem−/− (n = 8; black) and Crem+/+ VSMCs (n = 8; white) normalized to the time point before Pdgf treatment (e). The differential proliferation curves of Pdgf-treated minus Pdgf-untreated VSMCs and the calculation of the f maximum cell index (ΔCI max; square) and the g time to the maximum (T ΔCImax) are shown (all n = 8). Note the increased proliferation rate in Pdgf-stimulated Crem−/− compared to Crem+/+ VSMCs, represented by the increased cell index of proliferation curves and the higher ΔCImax values, while the time to ΔCImax was not changed. Asterisk (*) denotes p < 0.05 vs. Crem+/+, and the cross (+) denotes p < 0.05 vs. control conditions. For statistical analysis of proliferation curves, a two-way repeated measures ANOVA and Tukey post hoc tests were used

