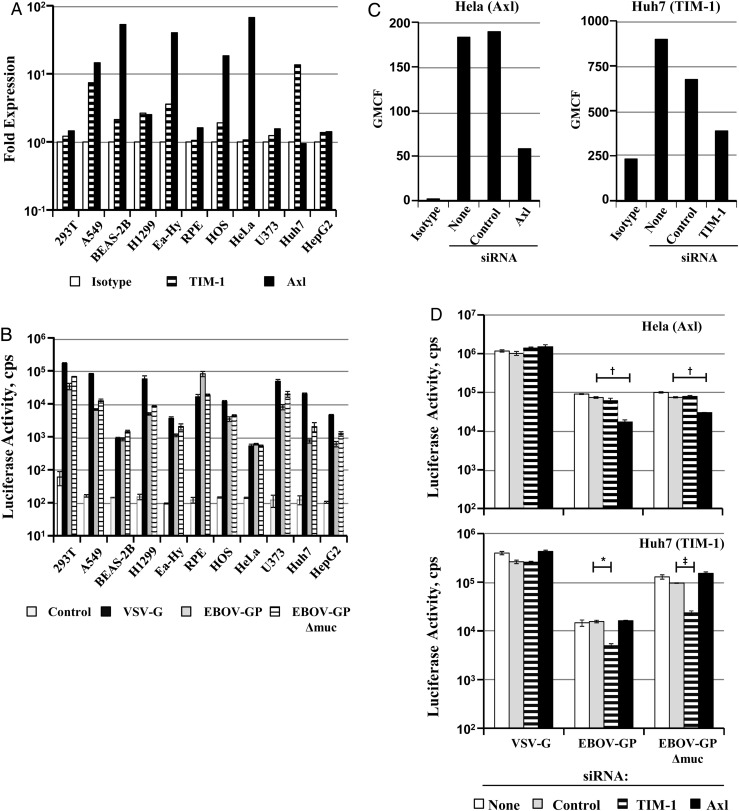
Figure 3.
Endogenous expression and augmentation of glycoprotein (GP)–driven entry by T cell immunoglobulin and mucin domain-1 (TIM-1) and Axl is limited to a subset of susceptible cells. A, The indicated cell lines were analyzed for endogenous surface expression of TIM-1 and Axl, respectively. For each individual cell line, the geometric mean channel fluorescence (GMCF) measured with specific antibody is shown relative to GMCF measured upon staining with an isotype-matched control antibody, which was set at 1. Results of a single representative experiment are shown and were confirmed in a separate experiment. B, The cell lines analyzed in A were transduced with pseudotypes bearing vesicular stomatitis virus glycoprotein (VSV-G), Ebola virus (EBOV)–GP, or EBOV-GP lacking the mucin domain (EBOV-GPΔmuc). Pseudotypes bearing no glycoprotein were used as a negative control. Luciferase activities in cell lysates were determined 72 hours after transduction. Results of a single representative experiment performed with triplicate samples are shown; comparable results were obtained in ≥1 independent experiment. Error bars indicate standard deviations. C, HeLa cells, which express endogenous Axl, and Huh-7 cells, which express endogenous TIM-1, were transfected with the indicated small interfering RNAs (siRNA). Expression of Axl on HeLa cells and expression of TIM-1 on Huh7 cells were determined with fluorescence-activated cell sorting 24 hours after transfection. Staining of untransfected cells with isotype-matched control antibody (isotype) served as negative control. Results of a single representative experiment are shown; similar results were obtained in a separate experiment. D, Cells transfected as described in C were transduced with the indicated pseudotypes. At 72 hours after transduction, cells were lysed, and luciferase activities in cell lysates determined. Results of a single representative experiment performed with triplicate samples are shown; 2 additional experiments yielded similar results. Statistical significance was calculated using the 2-tailed Student t test. *P < .05; †P < .01; ‡P < .001.

