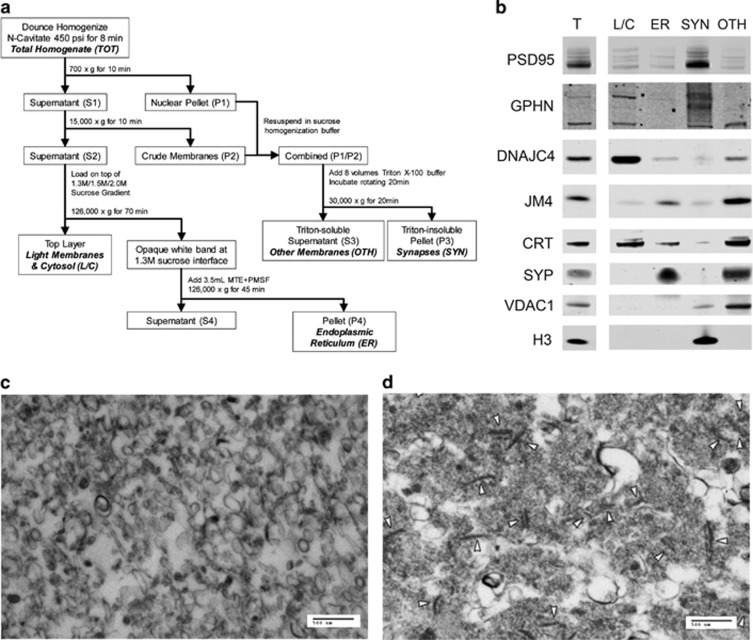
Figure 1.
Fractions enriched for light membranes and cytosol (L/C), endoplasmic reticulum (ER), excitatory and inhibitory synapses (SYN) and other intermediate membranes (OTH) generated from postmortem human cortex. (a) Schematic depiction of the centrifugation, differential sucrose gradient and Triton solubilization steps to produce L/C, ER, SYN and OTH-enriched fractions from nitrogen-cavitated samples. Briefly, after nitrogen-cavitated cortical homogenate samples undergo sequential centrifugations, S2 is loaded on top of a differential sucrose gradient and ultracentrifuged to separate the ER from other light membranes and cytosolic components based on membrane density. The ER membranes appear as a semi-opaque white band, and the L/C remains suspended in the translucent top layer. P1 and P2 from the first centrifugation steps are resuspended, combined and solubilized by a brief incubation with Triton X-100 buffer. Following centrifugation, the Triton-insoluble synaptic membranes are concentrated in the resulting P3, while S3 contains the remaining heavy and intermediate membrane components. (b) Representative images from western blots of total homogenate, L/C, ER, SYN and OTH fractions probed for various subcellular markers to validate the efficacy of the fractionation method in postmortem human cortex. Target marker proteins include postsynaptic density protein 95 (PSD95), for excitatory synapses; gephyrin (GPHN), for inhibitory synapses and extrasynaptic membrane; DnaJ/hsp40 homolog subfamily C member 4 (DNAJC4), for cytosol; PRA1 family protein 2 (JM4), for ER and Golgi membranes; calreticulin (CRT), for ER lumen; synaptophysin (SYP), for extrasynaptic membranes; voltage dependent anion-selective channel protein 1 (VDAC), for mitochondria; and histone 3 (H3), for nuclei. (c and d) Representative electron microscopy (EM) image of the ER and SYN fractions (scale bars, 500 nm). (c) ER membrane is enriched and no other identifiable structures or organelles are evident in the ER fraction. (d) Synapses, indicated by white arrowheads, are enriched and no other intact structures or organelles are visualized in the SYN fraction. MTE, D-mannitol, Tris-base, and EDTA; PMSF, phenylmethylsulfonyl fluoride.

