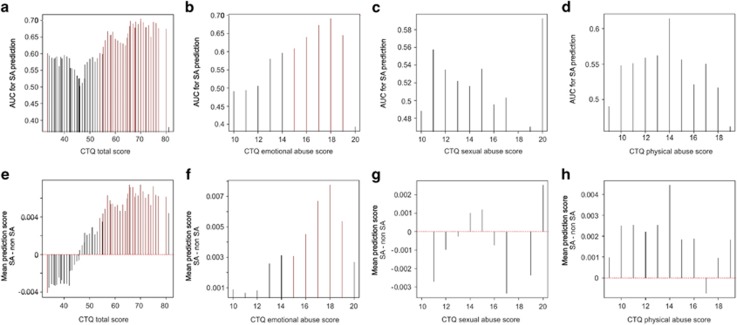
Figure 1.
Sliding window analysis of lifetime suicide attempt prediction. Barplots of the area under the receiver operator characteristic curve (AUC) generated using the suicide prediction model (y axis) as a function of childhood trauma scores. For each group (x axis), individuals are included if they fall within a window of (a) ±30 points on the total Child Trauma Questionnaire (CTQ) scores, (b) ±5 points on the emotional abuse subscale, (c) ±5 points on the sexual abuse subscale and (d) ±5 points on the physical abuse subscale from the Grady Trauma Project (GTP) cohort. Differences in sliding window lengths (±30 versus ±5) allow for inclusion of similar sample numbers per group (mean sample size ~57 per window for all analyses). Vertical red bars represent the windows where 95% confidence intervals for the AUC do not encompass a null prediction of 0.5. Barplots of the mean suicide attempt (SA) minus non-SA score generated by the suicide prediction model (y axis) as a function of the middle position of sliding window encompassing all individuals within a window of (e) ±30 points on the total CTQ scores and those representing only ±5 points on the (f) emotional abuse, (g) sexual abuse and (h) physical abuse subscales (x axis) from the GTP cohort. All vertical red bars represent those windows where 95% confidence intervals for the AUC do not encompass a null prediction of 0.5.

