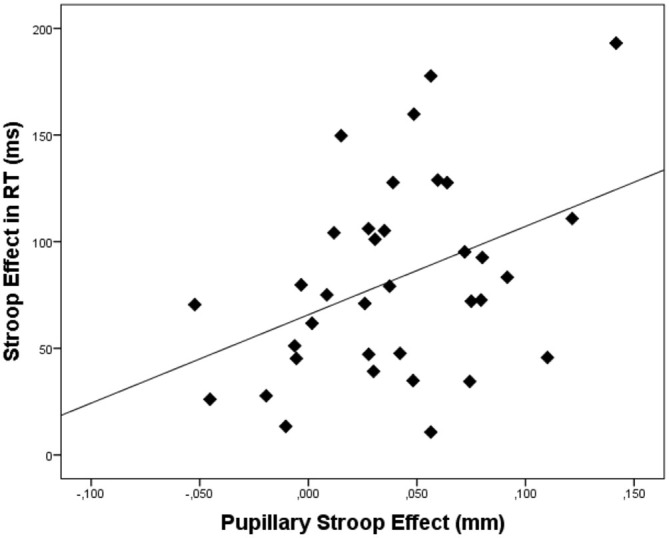
Figure 3.

Scatterplot depicting the relation between the pupillary Stroop effect (i.e., the difference in pupil dilation between correct incongruent and correct congruent trials) and the Stroop effect (i.e., the difference in reaction times between correct incongruent and correct congruent trials). Dots represent data of individual participants.
