Figure 1.

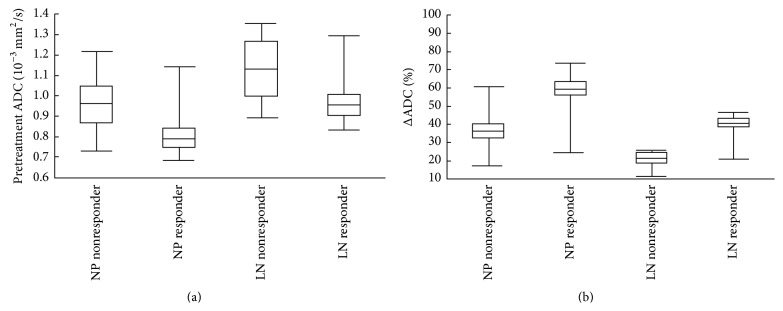
(a) Comparison of pretreatment ADCs for responders and nonresponders in patients with NPC. Responders had significantly lower pretreatment ADCs (primary lesions, P = 0.012; metastatic adenopathies, P = 0.013). (b) Comparison of ΔADCs for responders and nonresponders. Responders had significantly higher ΔADCs (primary lesions, P = 0.008; metastatic adenopathies, P < 0.001). Box-whisker plots are presented with median (-), interquartile range (box), and minima/maxima (-). NP = nasopharynx; LN = regional neck lymph nodes.
