Figure 1.
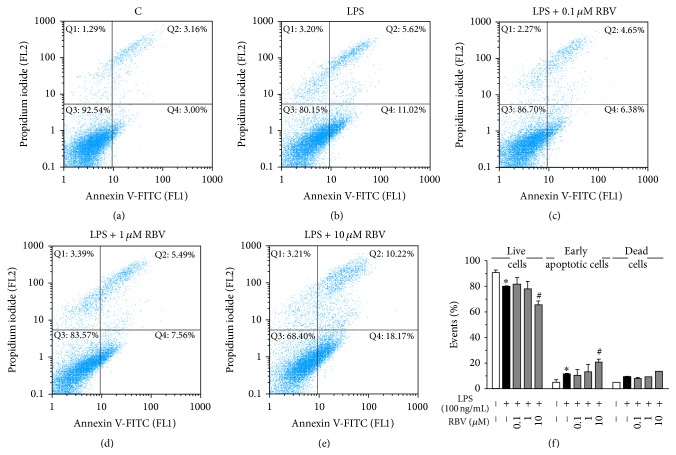
Annexin V/PI staining was analyzed with FACS after 24 h of RBV treatment and LPS stimulation. Representative dot plots are shown for control (a), LPS (b), and LPS stimulated BV-2 cells treated with 0.1 μM (c), 1 μM (d), and 10 μM RBV (e). (f) Histogram representing percentage of live, early apoptotic, and dead cells after RBV pretreatment and LPS stimulation. Data represent mean ± SEM from three independent cell preparations. ∗ P < 0.05 versus control group, # P < 0.05 versus LPS stimulated group.

