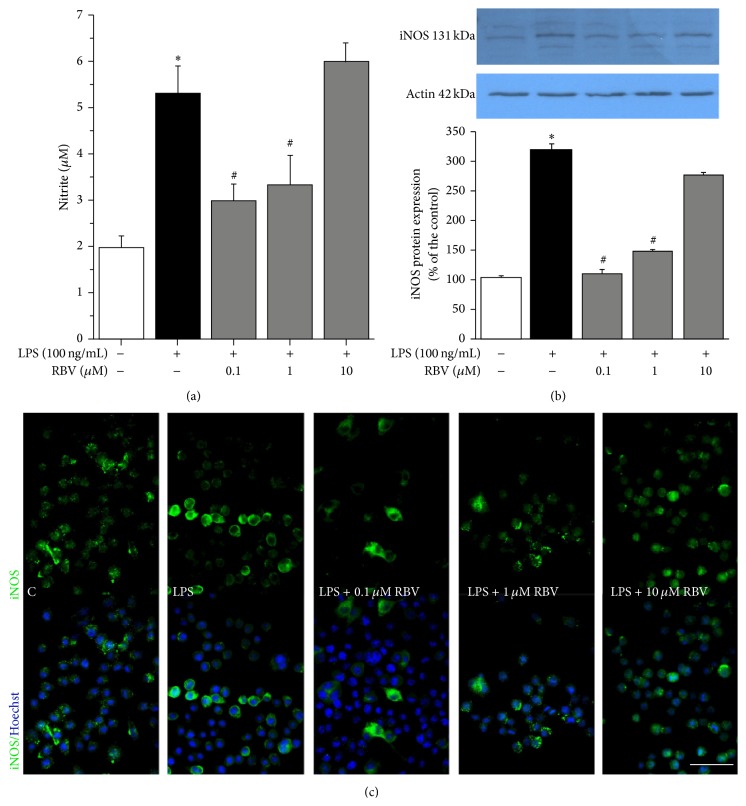
Figure 3.
(a) Effect of RBV on LPS triggered production of NO. (b) Representative Western blot of iNOS expression. Graph shows mean iNOS protein abundance (± SEM), from n = 3 separate determinations, expressed relative to the abundance of β-actin in each lane. Significance inside the graphs (a) and (b): ∗ P < 0.05 versus control group, # P < 0.05 versus LPS stimulated group. (c) Panel of immunofluorescence labeling of BV-2 cells against iNOS (green) and counterstained with Hoechst (blue) after 24 h of stimulation with LPS and treatment with RBV. Scale bar for all pictures in panel (c): 50 μm.

