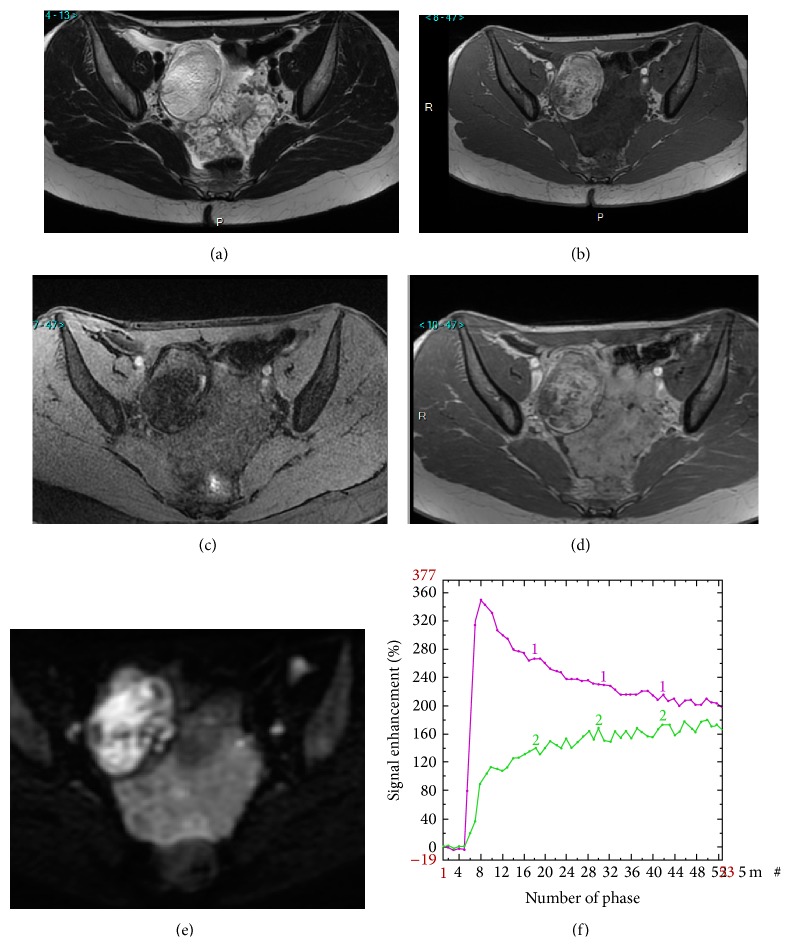
Figure 7.
Added value of perfusion and diffusion weighted imaging. Right side: mature cystic teratoma (purely fatty mass: ADNEXMRscore 2). Left side: borderline serous cystadenoma (solid tissue which is bright on T2 and DW sequence and that enhances with a TIC type 2: ADNEXMRscore 4). T2 weighted sequence (a), T1 weighted sequence (b), T1 weighted sequence with fat saturation (c), T1 weighted sequence with gadolinium (d), DW sequence (e), and PW analysis comparing myometrial TIC (1) and tumoral TIC (2) (f).

