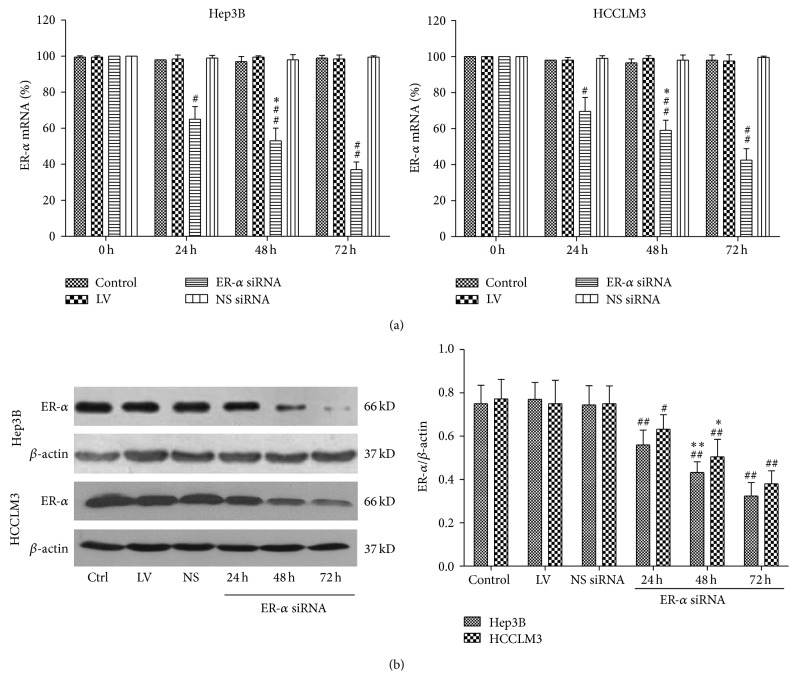
Figure 1.
Effects of siRNA on ER-α expression in Hep3B and HCCLM3 cells. ER-α expression levels were analyzed by (a) real-time PCR and (b) western blot at the different times after virus infection. LV: lentivirus; NS siRNA (NS): nonsilencing siRNA; cells untreated served as control. Data were expressed as mean ± SD. Compared with other groups, # P < 0.05, ## P < 0.01; compared with other time points, ∗ P < 0.05, ∗∗ P < 0.01.

