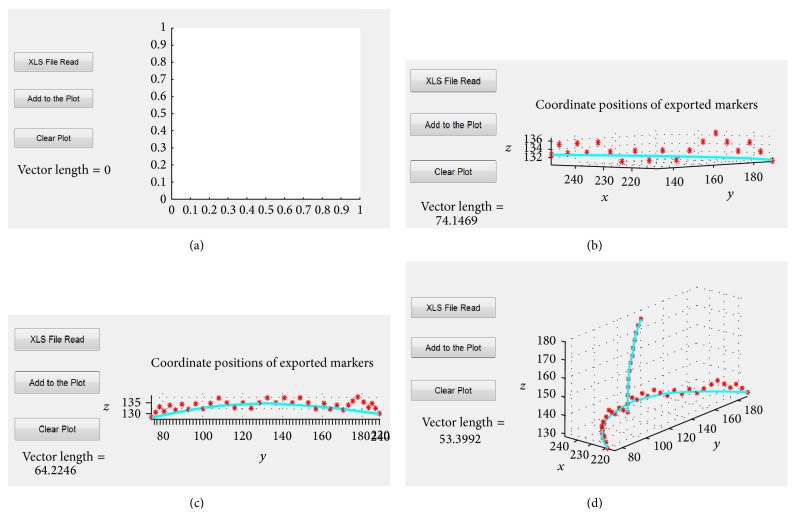
Figure 4.
The Graphical User Interface that supports the import and plotting of POIs drawn on a surface mesh. Panel (a) shows the starting view and each consecutive panel ((b)–(d)) shows the addition of a new 3D path to the GUI. This is achieved by reading in XLS files containing the path data. The length of the most recently loaded 3D path is shown in the lower left corner of the GUI in mm.

