
Figure 1.
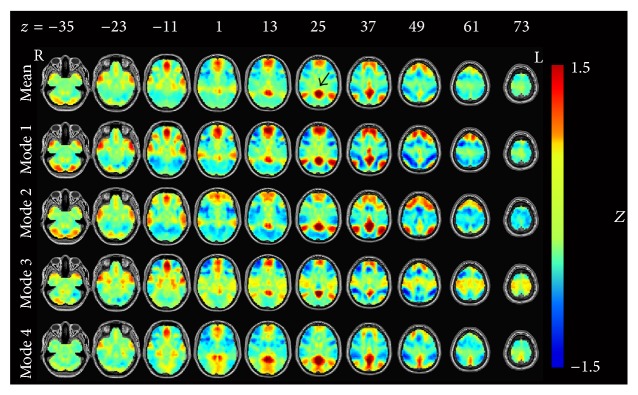
The posterior cingulate cortex- (PCC-) related modes after temporal decomposition. All results were converted to Z-maps and arranged by the occurrence frequency. The first line represents the average pattern of the four modes. Black arrow in the first row points out the seed region approximately.