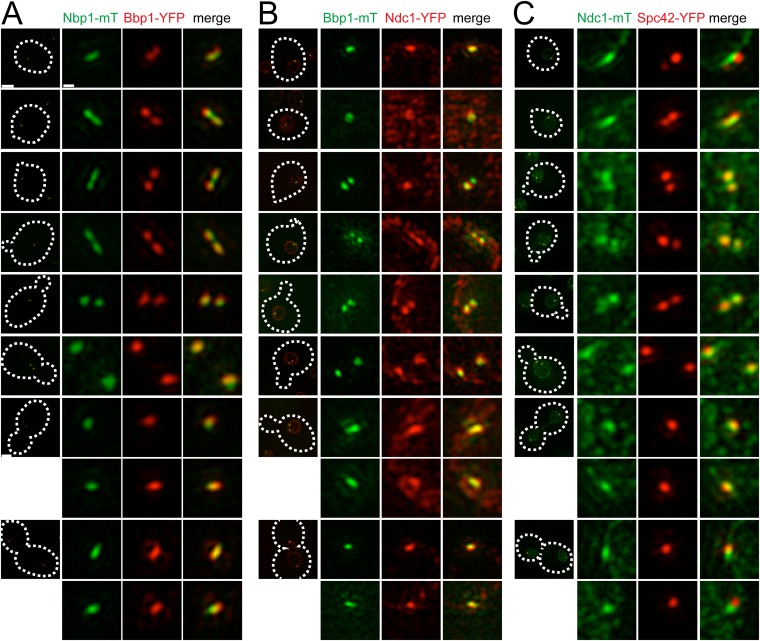
Figure 7. Cell cycle analysis of pore membrane component localization.
SIM images from asynchronously growing cells containing Nbp1-mTurquoise2 (green) and Bbp1-YFP (red) (SLJ7699, A), Bbp1-mTurquoise2 (green) and Ndc1-YFP (red) (SLJ9231, B) and Ndc1-mTurquoise2 (green) and Spc42-YFP (red) (SLJ7941, C) are arranged based on bud size and distance between SPBs (or satellite structure), which approximates position in the cell cycle. A merged image showing the cell outline (dashes) is shown on the left. Bar, 2 µm. The SPB(s) are shown to the right of each cell. Bar, 200 nm.

