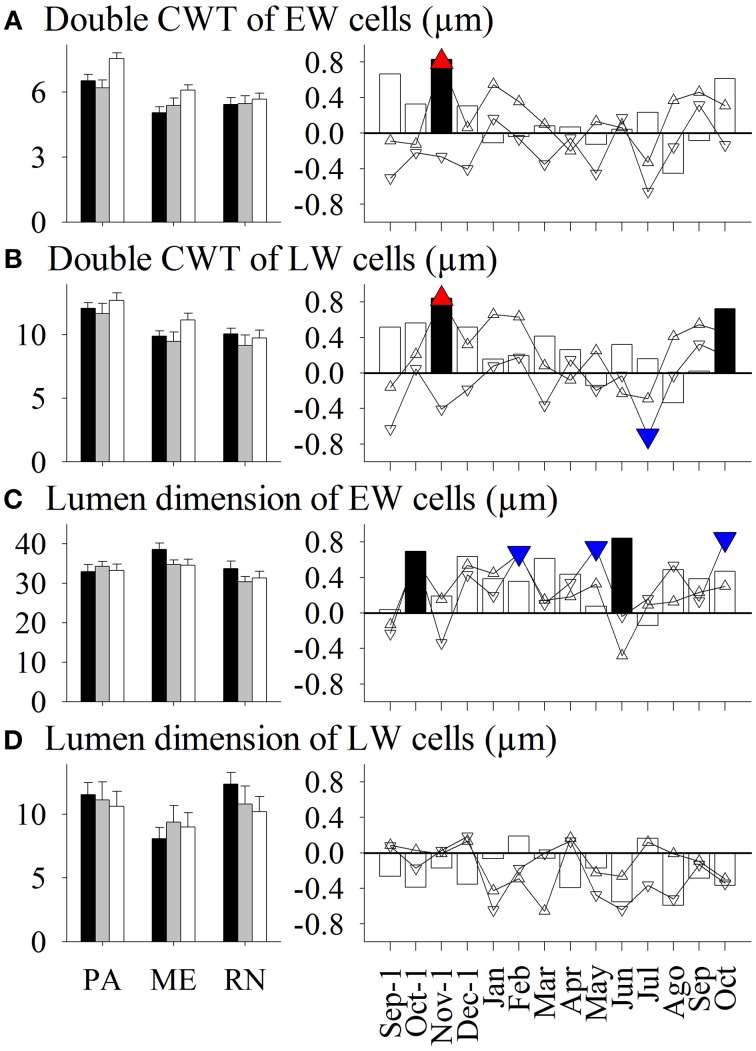
Figure 4.
Left figure: Mean values of double cell wall thickness (CWT) of (A) earlywood (EW) cells and (B) latewood (LW) cells, and lumen dimension of (C) earlywood cells and (D) latewood cells in Picea abies at Panška reka (PA), Menina planina (ME) and Rájec-Němčice (RN) in 2009 (black columns), 2010 (gray columns), and 2011 (white columns). Right figure: Correlation coefficients calculated between mean values and climatic conditions in this period. Significance at a 95% level indicates the following symbols: red triangles up for maximum temperature, blue triangles down for minimum temperature and black columns for precipitation.

