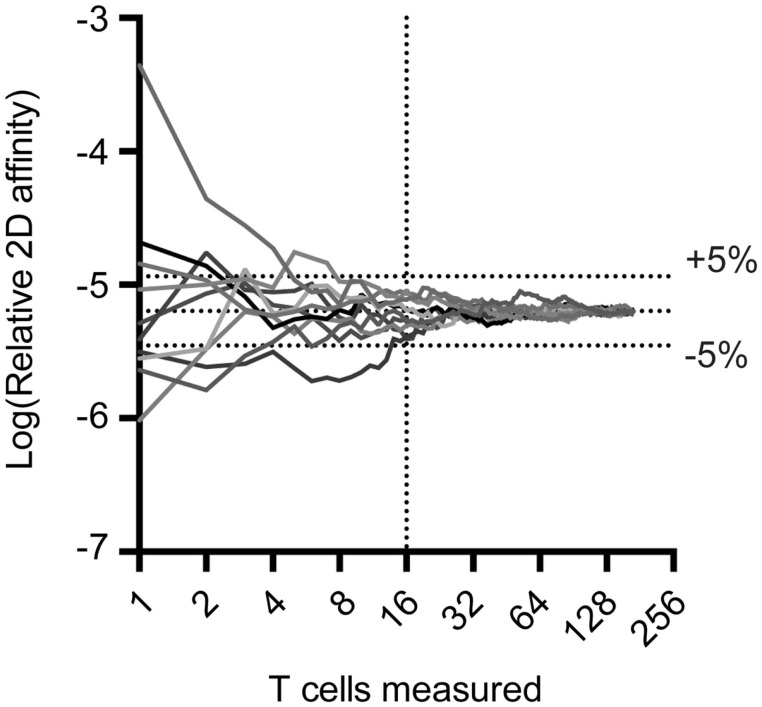
Figure 1.
Random sampling of measured TCR:pMHC reveals rapid approach to average affinity for an entire population. Previous 2D affinity measurements of MOG-specific CD4 T cells were combined and randomly arranged. A moving average was calculated and graphed as a function of the number of cells sampled. Cells were then randomly rearranged and moving average calculations were performed nine more times to generate the curves illustrated.

