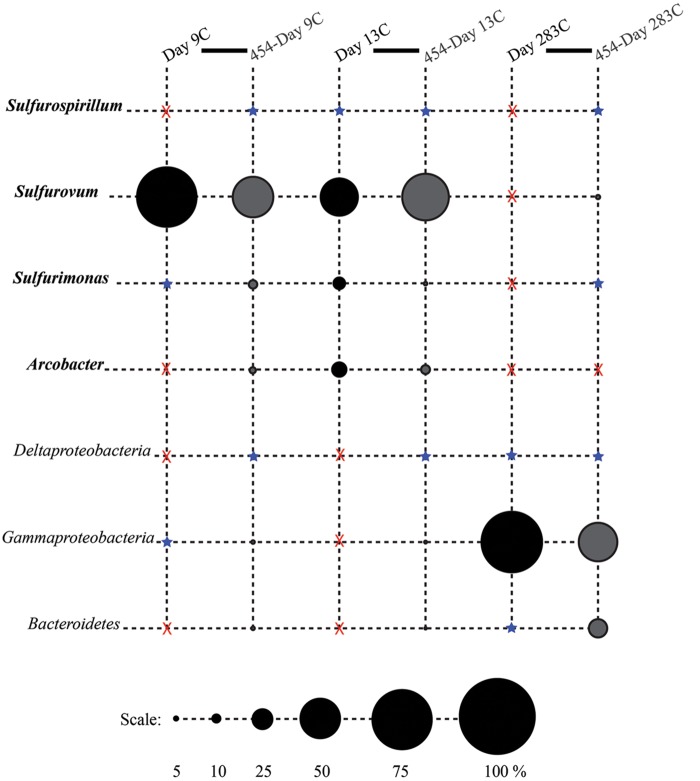
FIGURE 4.
Relative proportions of abundant phylogenetic groups for control treatments. Pyrosequenced samples are labeled as 454-sample name (gray shading). All other samples were sequenced with the Sanger method (black shading). Epsilonproteobacterial groups are labeled in bold italics. Groups in which no clones/tags were sequenced are indicated with a red ‘X.’ Groups which were detected at or below 2% are indicated with a blue star.

