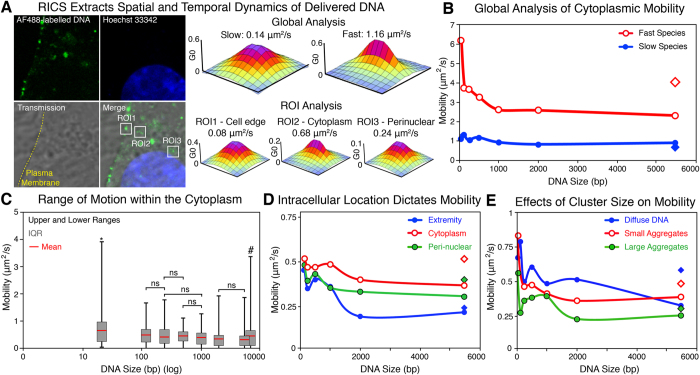
Figure 2. Application of RICS to Quantify Cytoplasmic Mobility.
(A) Confocal image of myoblast cell transfected with the fluorescently labelled 495 bp fragment. RICS analysis provides quantification of mobility with 3D SCAF fits through a global analysis of the entire cytoplasm and ROI analysis of the selected ROIs along the cell edge (ROI1), cytoplasm (ROI2) and peri-nuclear region (ROI3). (Image size 12.8 × 12.8 μm). (B) Global analysis of delivered DNA mobility ranging from 21 bp to 5.5 kbp through RICS analysis. Two distinct species were isolated, a slow species exhibiting statistically insignificant differences (blue, filled), and a fast species (red, empty) with a size dependent decay (n = 27–51 cells). (C) ROI analysis of the delivered DNA demonstrates the range of motion observed within the cytoplasm of myoblasts. All DNA size exhibited complete immobility except for the 21 bp indicated by*. (# Column was shifted slightly to the right for the circular plasmid as it overlapped and covered the graph for the linear plasmid). (D) ROI analysis showing the influence of intracellular location on the mobility of delivered DNA along the cell extremity (blue, whole), cytoplasm (red, empty) and peri-nuclear region (green, black ring). (E) ROI analysis showing the effects of DNA aggregation and clustering on the delivered DNA mobility. DNA was identified as either non-clustered (diffuse) (blue, whole), small aggregates (<500 nm) (red, empty) or large aggregates (>500 nm) (green, black ring). (minimum cell number in ROI analysis = 15, minimum number of values = 83) (diamond in graphs represents circular plasmid)

