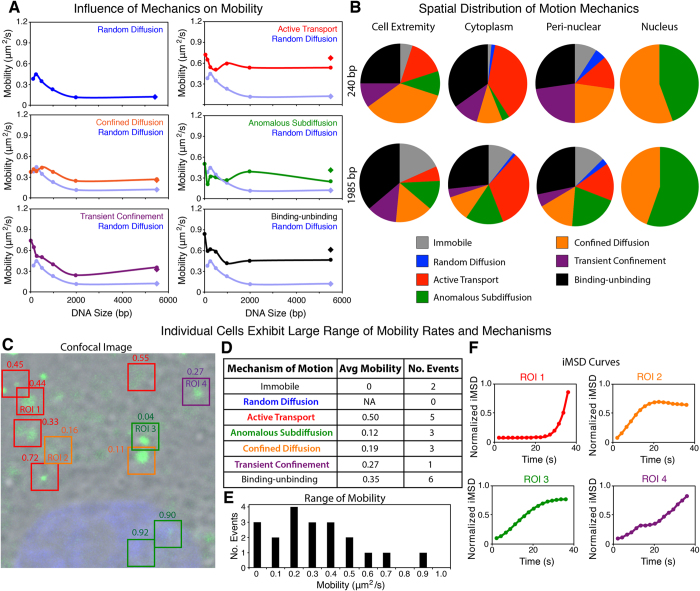
Figure 3. Determining the Mechanics of DNA Mobility through iMSD.
(A) Rate of motion observed in random diffusion (blue), active transport (red), confined diffusion (orange), anomalous subdiffusion (green), transient confinement (purple) and binding-unbinding (black) events across the 21 bp–5.5 kbp DNA range within the cytoplasm of myoblasts. Random diffusion was used as a reference in the graphs comparing all other mechanisms of motion. (iMSD analysis, n = 13–17 cells) (diamonds in graphs represents circular plasmid, in random diffusion the linear and circular plasmid are the same value). (B) Pie charts depict the spatial distribution of each mechanism at the cell extremity, cytoplasm, peri-nuclear region and nucleus for the 240 bp and 1,985 bp DNA lipoplexes. (C–F) Individual cells exhibited a range of motion and different mechanisms within the cytoplasm. (C) Confocal image of a myoblast transfected with the linear plasmid lipoplex (green) and with the nucleus counterstained (blue). ROIs highlighted are coloured based on the transport mechanism present, and labelled with the rate of motion (in μm2/s). (Field of view 16.5 × 16.5 μm). Within the single cell a variety of mechanisms were isolated (D), including active transport (ROI1), confined diffusion (ROI2), subdiffusion (ROI3) and transient confinement (ROI 4) shown in iMSD graphs (F) and representing ROIs highlighted in image C. In iMSD curves, the iMSD y-axis was normalised to 1. (E) Range of motion identified within the cell shown ranging from 0–0.89 μm2/s.

