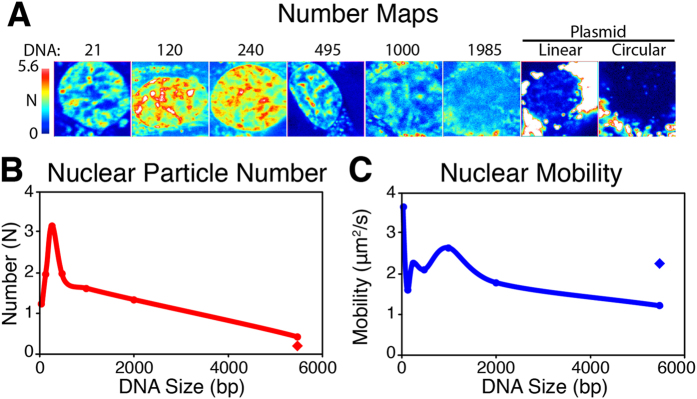
Figure 4. Nuclear Dynamics and Particle Number of Delivered DNA.

(A) N&B analysis provides the number calculation with an N map showing the DNA particle number within the nucleus after 36 h. (B) flDNA particle number, N, and (C) size dependent mobility in cells transfected with a range of DNA sizes. All images are to the small scale. (n = 10 (21–1985 bp) and 8 (plasmids)) (Field of view 16.5 × 16.5 μm) (diamond in graphs represents circular plasmid).
