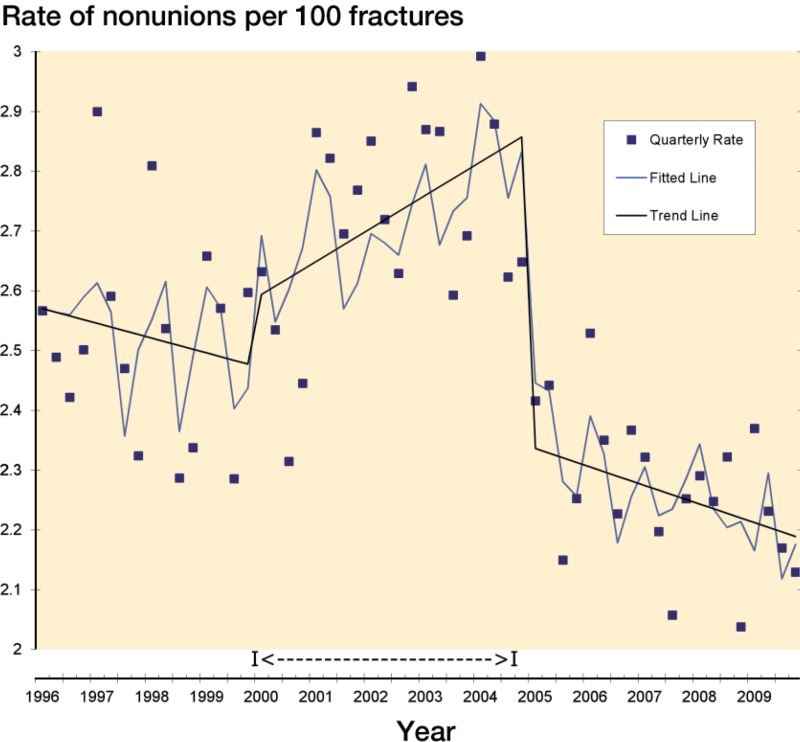
Figure 6.
Interrupted time-series analysis of quarterly non-union rates per 100 patients with fractures. Individual squares show the number of non-unions in the quarter divided by the number of fractures in that quarter. The gray line shows the average trend of the non-union rate. The solid line shows the time-series trend. The dashed line indicates the period when the use of specific COX-2 inhibitors was prevalent in the USA.

