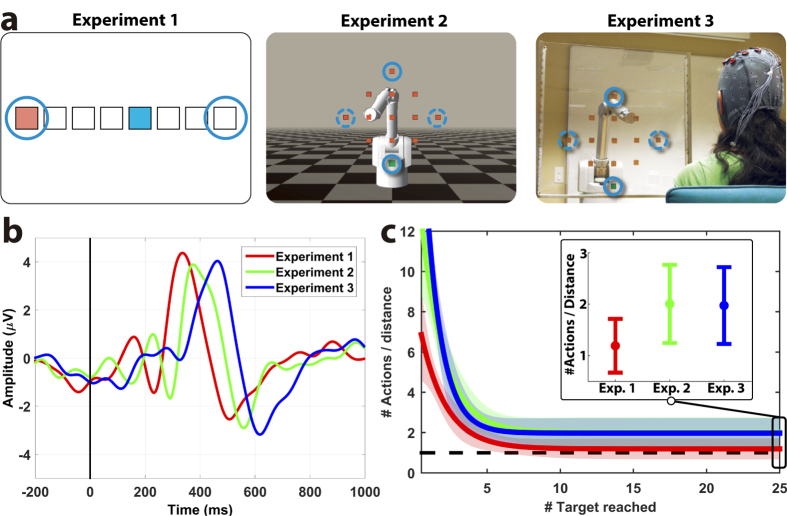
Figure 2. Learning optimal behaviours from error-related brain activity.
(a) Experimental setup. In Experiment 1, the device (blue square) can move one position to the left or to the right in order to reach the target (red square). In Experiments 2 and 3, the robot moves left, right, up, or down across 13 states (orange squares) to reach a target (green square). Solid and dashed circles denote practice and new targets, respectively. (b) Grand-average difference event-related potentials (ERP) for each experiment during the training phase at channel FCz (N = 12); t = 0 ms represents the action onset. This difference ERP is computed as the difference of the subjects’ evoked EEG response after erroneous and correct actions of the device. (c) Normalized number of actions needed to reach the targets within a run. Lines correspond to the fitting of an exponential function to the data of each experiment, with the 95% confidence interval shown as shadows of the fitting line (all subjects combined). The horizontal line (Y = 1) indicates the optimal performance (See Methods). The inset shows the mean (±the 95% confidence) convergence value of the curve for each experiment.

