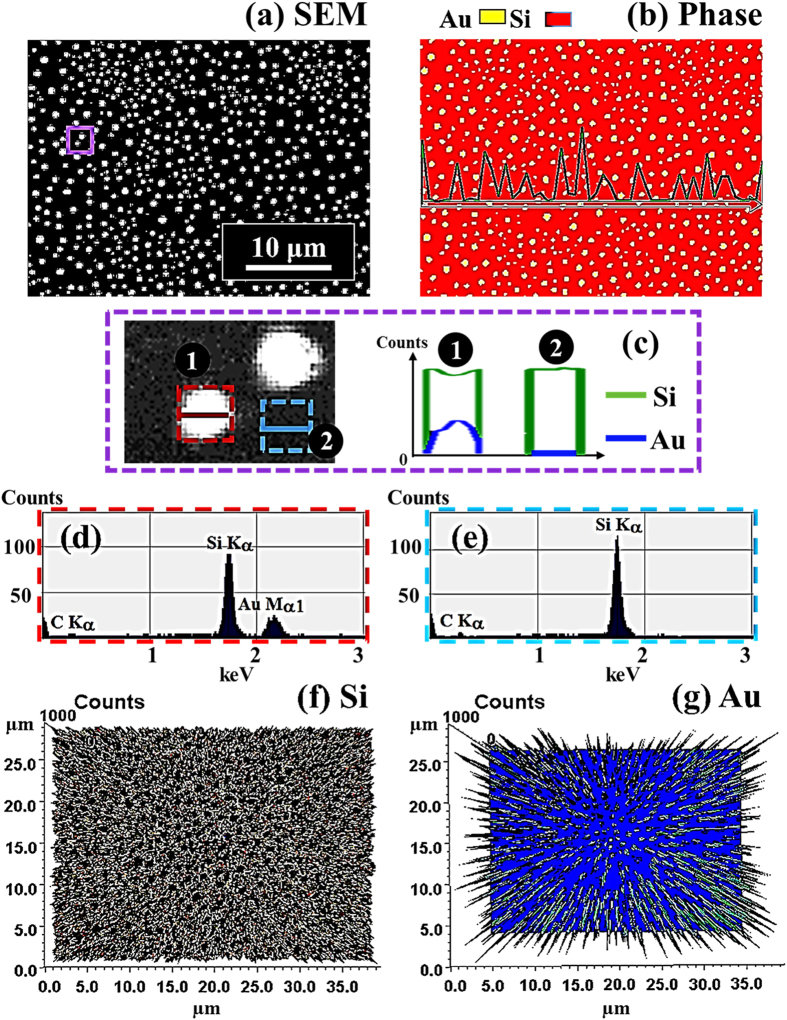
Figure 8. EDS phase maps and spectra of the Au nano-crystals fabricated at 900 °C with the 15 nm DA on 4H-SiC (0001).
(a) SEM image of 40(x) × 30(y) μm2. (b) Combined phase map of Au (yellow) and Si (red). (c) Line-profiles of element counts of Si (green) and Au (blue). (d,e) Corresponding EDS spectra from the red box (d) and blue (e). (f,g) 3-D top-view phase maps of Si and Au.

