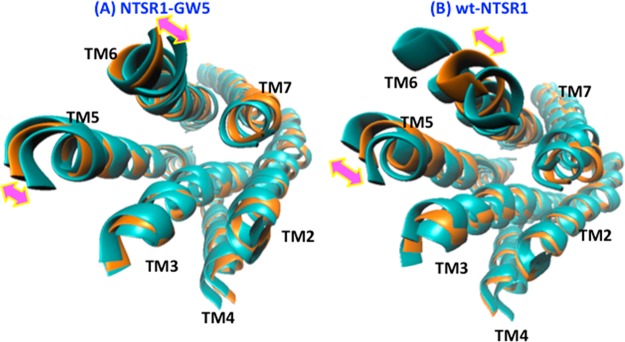
Figure 3.

Two principal components represented by the double arrows showing the dominant motion in the NTSR1-GW5 (A) and wt-NTSR1 (B) simulations. Shown in this figure is the intracellular view of the TM bundle. The orange-colored structures are the average structures for each system generated from covariance matrix and from filtering the trajectories, and the cyan-colored structures are the representative structures of the most populated cluster in the ensembles.
