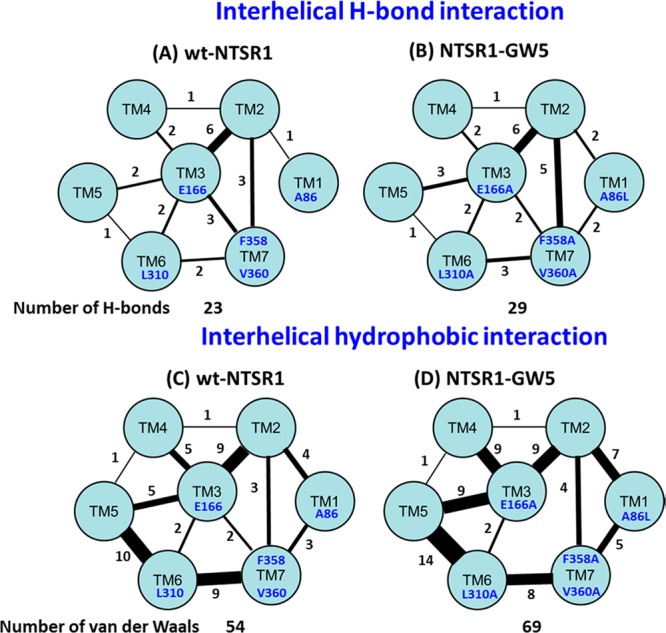
Figure 5.

Total number of interhelical interactions between various pairs of helices, calculated for the two NTSR1 systems. Parts A and B show the interhelical hydrogen bonds between each transmembrane helix in the wt-NTSR1 and NTSR1-GW5, while parts C and D show the interhelical vdW interactions. The number on each line is the total number of each type of interhelical interactions between pairs of TM helices.
