
Figure 1.
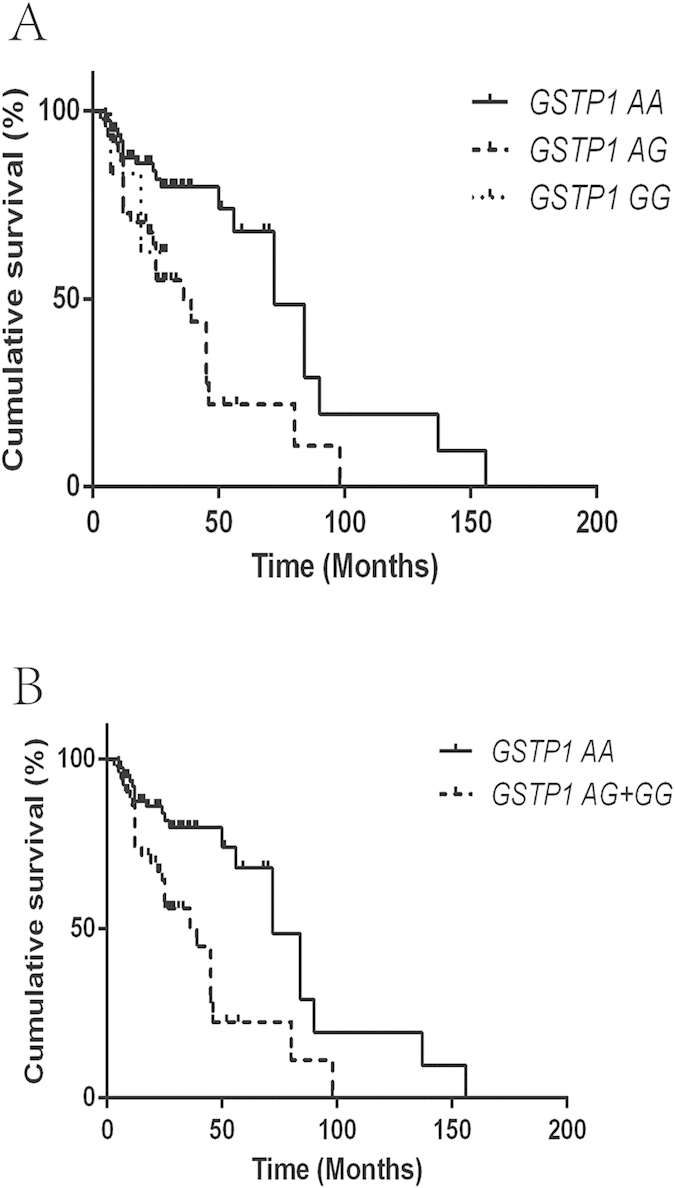
(A) The Kaplan–Meier curve representing the association between the GSTP1 rs1695 genotypes and recurrence-free survival of patients treated with epirubicin. (B) The Kaplan–Meier curve representing the association between the GSTP1 rs1695 AA vs. AG+GG genotype and recurrence-free survival of patients treated with epirubicin.