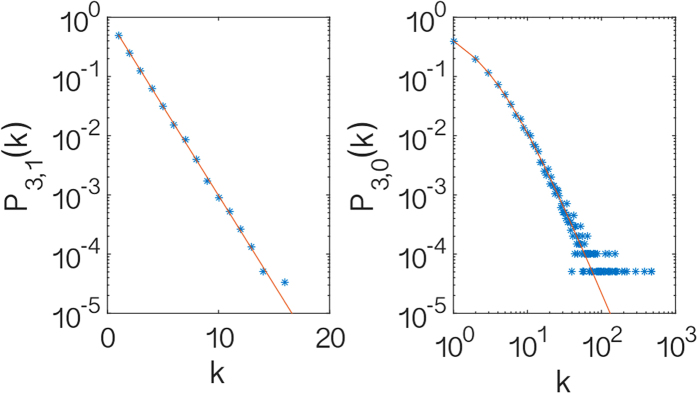
Figure 3. Distribution of the generalized degrees.

The distribution of the (non-trivial) generalized degrees  and
and  in dimension d = 3 are shown. The star symbols indicate the simulation results while the solid red line indicates the theoretical expectations given respectively by Eqs. (11) and (12). In particular we observe that
  is exponential while
  is scale-free implying that the CQNM in d = 3 is scale-free. The simulation results are shown for a single realization of the CQNM with a total number of nodes N = 2 × 10⁴.
